I think the map is just not realistic enough to pass. Even if we can elect Democrat Roy Barnes as Governor, the best we could do is probably a bipartisan redistricting. Anyway, this is the map I would draw if I could decide what the Georgia map would be. I planned to try for an 8-6 Democratic map with creating a new Democratic district and weakening one Republican. If I tried really hard, I might have created a new Democratic district in the Atlanta metropolitan area. I did not want to weaken new Democrats and Obama turnout may have overestimated the Democratic Party strength around Atlanta. However, the minority population around Atlanta is growing quickly. This will make the Democrats stronger there. Just so people know, Safe Democrat/Republican means that the district is solidly for one party. Likely Democrat/Republican means that the district appears safe but could become competitive. Lean Democrat/Republican means that the district will be competitive but one party is ahead. Toss Up means that the district could go either way. Now here are the maps (Yes, I finally did not use a camera to get these shots.)
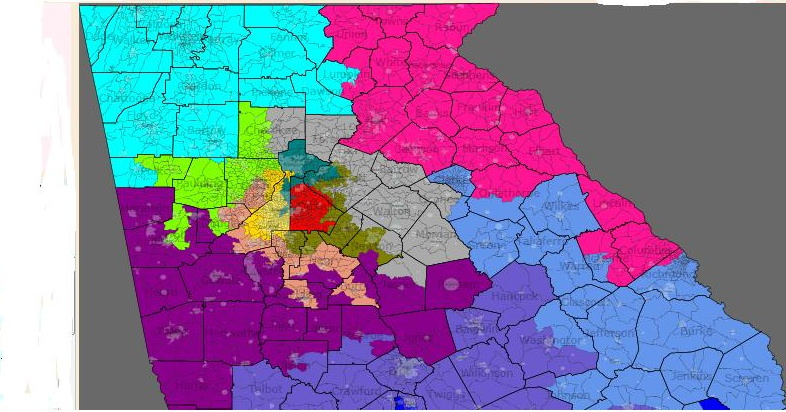
North Georgia
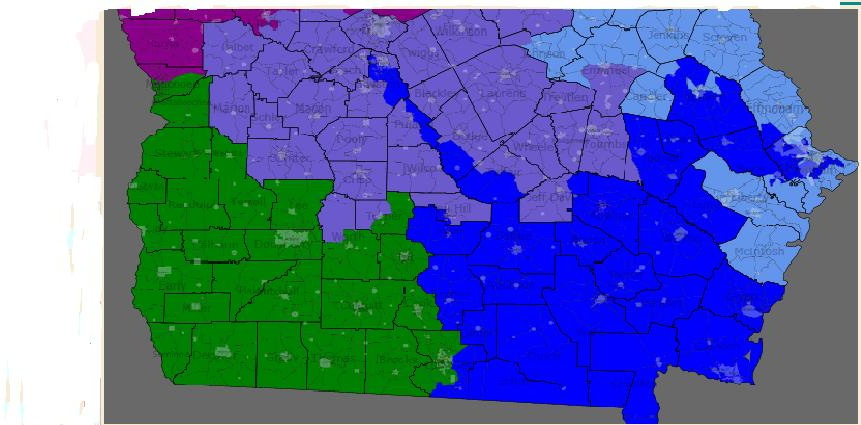
South Georgia
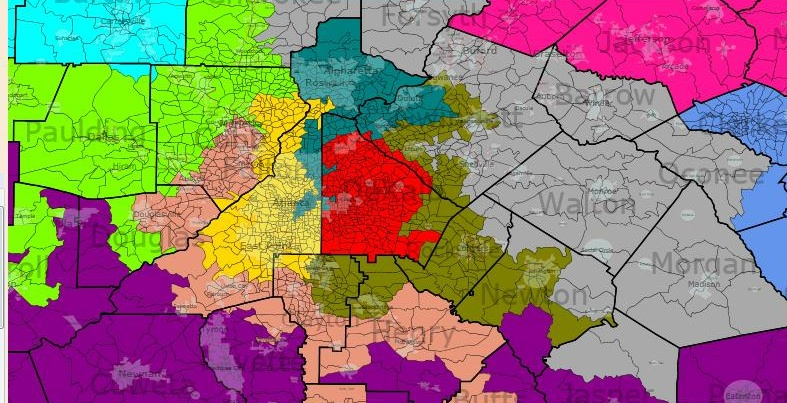
Atlanta area
District 1 Jack Kingston (R) Blue
I kept this district mostly the way it is. It contains most of southern Georgia but Democratic areas are taken into the 2nd, 3rd and 12th district. I took out some counties that were in the 12th to get them into here. I also extended this district to take in some Conservative parts of Warner Robins. Jack Kingston and any Republican should have no trouble here. It probably voted 69% for McCain.
Stats are 21% African American and 71% White. Status is Safe Republican.
District 2 Sanford Bishop (D) Green
Unfortunately, I had to weaken Bishop a bit to strengthen Democrat Jim Marshall in the 8th district. I put in some Republican counties that were originally part of the 8th. The district contains the southwestern part of the state which leans Democratic but extends east a bit to take in Republican counties that were in the 8th. Basically, I made the map of southern Georgia look like the map it used to be. Still, Bishop has been winning easily and unless he faces a big challenge, he should continue to win. I think that McCain won here with 51% of the vote.
Stats are 43% African American and 49% White. Status is Safe Democrat.
District 3 Lynn Westermoreland (R) Purple
Not much change to this district. All I did was remove some African American areas in the Republican counties this district contained. Since many African Americans are moving out of the Atlanta core, the African American population is growing here. Still, it should not be enough to affect the leaning of this district. I was also surprised that this district is more rural than suburban. Its growth was below the Georgia average. I think McCain won about 68% of the vote here.
Stats are 19% African American and 75% White. Status is Safe Republican
District 4 Hank Johnson (D) Red
This is one of the African American majority districts. It is centered in De Kalb County and for population purposes; I gave it a slice of Gwinnett County. I had to reduce the African American percentage a bit to strengthen other districts. Still, the only threat to Hank Johnson is a primary challenge. Obama probably won about 77% of the vote here.
Stats are 52% African American, 12% Hispanic and 29% White. Status is Safe Democrat.
District 5 John Lewis (D) Yellow
I kept this district mostly where it used to be and it should stay safe. It is another African American majority district. Even though I took out a few Atlanta precincts and extended the district into Cobb County, it is still very safe for John Lewis. This is a solid district and since Lewis is very popular, he does not even have to worry about a primary challenge. Obama probably won with 75% of the vote here.
Racial stats are 52% African American, 7% Hispanic and 36% White. Status is Safe Democrat.
District 6 Tom Price (R) Teal
I hope I put enough Democrats in this district to knock out Tom Price. Even though I kept some areas of the old 6th district in such as Roswell, this should not be much of a threat to a Democratic takeover. I removed all of Cherokee which gave McCain a margin of 48,000 votes. The rest of the old district probably gave a 20,000 vote margin to McCain. I removed all of Cobb County too and added part of Gwinnett County. I even sent a little finger down into Atlanta to pick up some heavily African American precincts. In parts of the South, the electorate is almost completely racially polarized. That means that race almost completely determines the party. In this district, the percentage of White Democrats is much higher than the percentage of minority Republicans. With the inclusion of a bit of Atlanta, this will weaken Price and he may want to run in another district even though he lives in Roswell. He was elected in 2004 so he is not as entrenched as he could be. I believe that Obama won about 52% of the vote here.
The racial stats are 18% African American, 14% Hispanic, 8% Asian and 58% White. Status is Toss Up/Lean Democrat depending on the competition.
District 7 John Linder (R) Gray
This district mostly contains the leftovers from other districts in Gwinnet County. I designed this to take in all the Republican parts of Gwinnet County and other Republican suburbs. If the minority growth in the Atlanta area does not slow down, this district might be more competitive in about ten years. For now, it is safe for John Linder. McCain probably won here with about 67% of the vote.
The racial stats are 10% African American, 7% Hispanic and 79% White. Status is Safe Republican.
District 8 Jim Marshall (D) Light Purple
Marshall recently has had a few close races in a district that voted 56% for McCain. This is why I decided to focus on strengthening his district. I extended it further east to pick up heavily Democratic Hancock County and Washington County. I sent this district further west to pick up Talbot, Macon and a few other Democratic counties. I had to remove the swing county Newton because Mac Collins (R) lives in it and he gave Marshall a very tough race in 2006. Most of the southern Republican counties in this district went to the 2nd and 1st districts. With the addition of Democratic counties and the exclusion of more Republican ones, I was able to increase the African American percentage from 32% to 41%. That should be high enough to protect Marshall. I estimate that Obama won about 51% of the vote in this district.
The racial stats are 41% African American and 53% White. Status is Likely Democrat.
District 9 Nathan Deal (R) Bright Turquoise
I did not change this district much. What is there to change anyway? The district was pretty Conservative before and it is still heavily Republican. If the growth in Atlanta continues, the counties closest to Atlanta in this district will start filling up with people. That should be the only change to this district. Either way, it is Republican for the foreseeable future. McCain probably won 72% to 77% of the vote here.
Racial stats are 6% African American, 10% Hispanic and 82% White. Status is Safe Republican.
District 10 Paul Broun (R) Bright Pink
I should say what I said about the 9th district. No Democratic will win here anytime soon. It will be even harder for one because I removed Athens from this district. I put it back into the 12th. The only bit of worry Broun should have is that Gainesville in Hall County has a fast growing Hispanic population. It should not be enough to alter the politics of the district too much. I estimate that McCain got about 70% of the vote here
. The racial stats are 10% African American, 10% Hispanic and 77% White. Status is Safe Republican.
District 11 Phil Gingerly (R) Light Green
Due to large population growth, this district just shrunk down to size. Also, I extended it into Cobb County which is more densely populated so that was another reason for the shrinking of this district. Even though Gingerly had a weak district when the Democrats drew the 2002 map, I gave him a strong one now. The reason I could not give him a weaker district was that I had to protect the 13th. Anyway, I do not believe Gingerly would be weakened enough if I gave him the Democratic parts of Cobb County. Cobb County voted 55% for McCain and the Republican suburbs make the Republican percentage increase. I estimate that McCain won here somewhere in the neighborhood of 65% of the vote.
The racial stats are 14% African American, 7% Hispanic and 75% White. Status is Safe Republican.
District 12 John Barrow (D) Light Blue
Again, I tried to make the lines resemble the 2002 Democratic redistricting. I gave Barrow all the Democratic parts of Savannah, Augusta and extended the district up to Athens. Whites are now a minority so I do not see the Republicans winning here. Even if Max Burns, the former Congressman from this district runs, he should not beat Barrow. I estimate that Obama won with 58%-60% of the vote here. Barrow is safe with the inclusion of Athens and the exclusion of Republican counties.
The racial stats are 43% African American and 49% White. Status is Safe Democrat.
District 13 David Scott (D) Tan
I kept his district pretty much the same except that I moved out the eastern part of his district. This district looks a bit gerrymandered because I moved it everywhere I could to pick up African American areas. Even though this district includes less of Clayton County than it used to, this district should still be heavily Democratic. I did not include enough African American areas to make their population go above 50% so this is not protected by the Voting Rights Act. Still, David Scott should have no problem getting elected here. Obama probably won here with about 70% of the vote.
The racial stats are 46% African American, 11% Hispanic and 39% White. Status is Safe Democrat.
District 14 No Incumbent Algae Green
This is really an eastern extension of the 2002 redistricted 13th. I send this district up into Gwinnet County to take in some heavily African American and Hispanic precincts. It also goes into Democratic trending Rockdale and Newton Counties. They are trending Democratic so quickly. Kerry won 40% of the vote in Rockdale County and Obama won 54%. Even though Whites are a plurality here, this district should have no trouble going for a Democrat. I estimate that Obama won here somewhere in the mid 60’s.
Racial stats are 38% African American, 13% Hispanic, 6% Asian and 41% White. Status is Safe Democrat.
First, I doubt your 6th would be very easy for a Democrat to win: the white parts are bright red. Second, I think you may have really endangered Sanford Bishop.