Here is another Democratic gerrymander, this time in Pennsylvania. I am not sure if we can pick up the entire legislature and retain the governorship. If we did, they would probably try to protect new Democrats instead of heading for an all out gerrymander. In my opinion, my map is not too realistic but just in case the Democrats have total control…. This map protects new Democrats while eliminating one Republican seat and endangering the incumbents of two others. I eliminated Charlie Dent’s seat assuming he survives 2010.I am aiming for a 14-4 Democratic delegation as a revenge for the planned 13-6 Republican delegation. My only worry for the Democrats is the 11th district with Paul Kanjorski but even there he should be safe. Here are the maps.
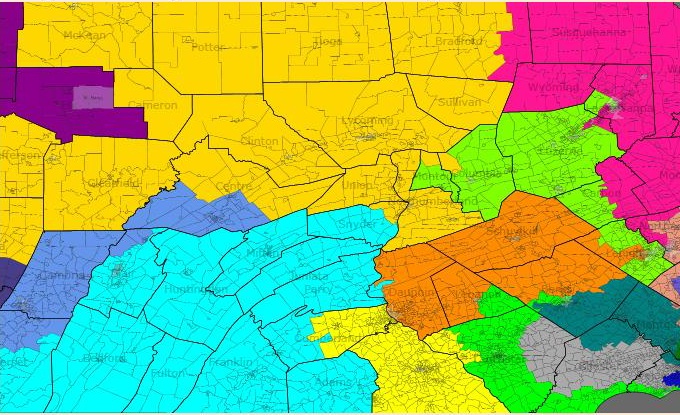
East Pennsylvania
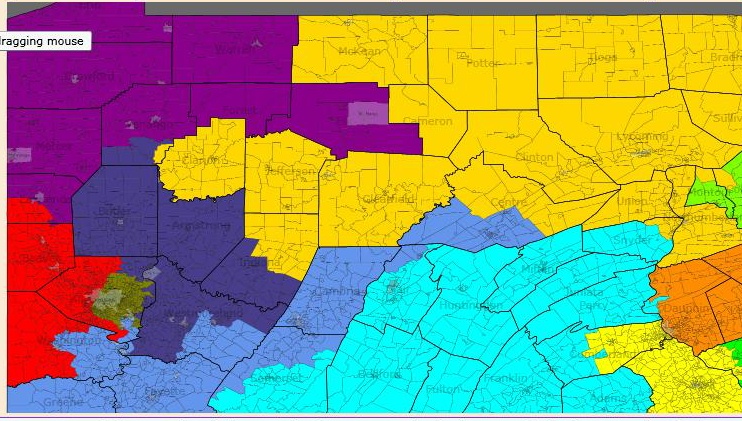
West Pennsylvania
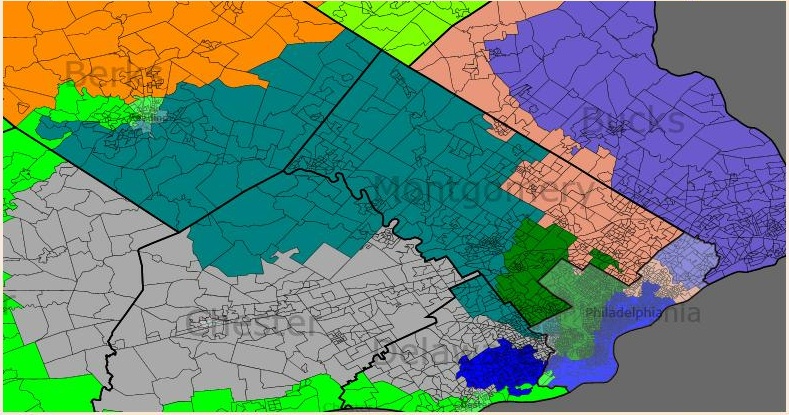
Philadelphia Area
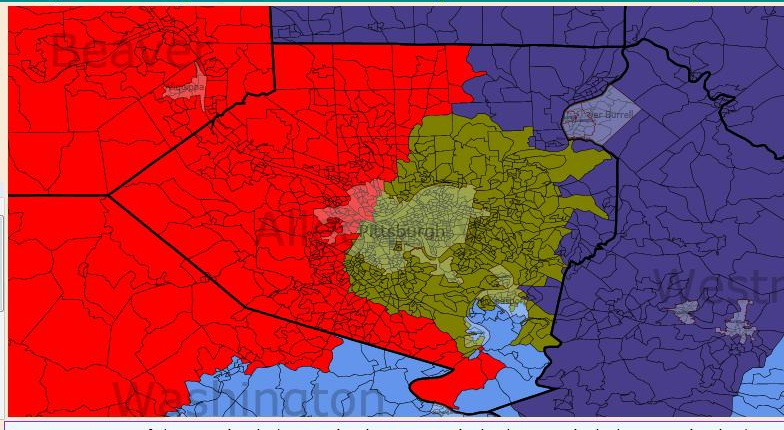
Pittsburgh Area
District 1 Robert Brady (D) Dark Blue
Robert Brady’s district was safe with the old map and will remain safe this time, even though his district is less safe. I removed some African American areas in western Philadelphia and Delaware County. I added some white parts of Delaware County but they should not affect the voting habits of this district much. Obama probably won 73% of the vote here. Racial stats are 19% African American, 18% Hispanic, 6% Asian and 53% White. Status is Safe Democrat.
District 2 Chaka Fattah (D) Dark Green
For population purposes, I had to send this district up into some white parts of Montgomery County but that should not alter the voting of this district. It stays mostly the same. Obama probably won 85% of the vote here. Racial stats are 58% African American and 32% White. Status is Safe Democrat.
District 3 Kathy Dahlkemper (D) Dark Purple
I was worried about her because she is a freshman. To protect her, I removed all of heavily Republican Butler County and substituted it with some marginal territory along the border. I extended it into the middle of the state to pick up Elk County which Obama barely won. I probably raised Obama’s performance to 53%. She should be safe without a strong challenge. Racial stats are 92% White. Status is Likely Democrat.
District 4 Jason Altmire (D) vs. Tim Murphy (R) Red
To strengthen Altmire, I removed all of Butler County and added some of marginal Washington County. I slipped in some precincts in Pittsburgh as well. He appeared safe in 2008 and he should be even safer. Murphy will probably run in the heavily Republican 17th district so Altmire should not worry. McCain probably won 50% of the vote here. Racial stats are 5% African American and 91% White. Status is Likely Democrat.
District 5 G.T Thompson (R) Yellow
I made this district more Republican to strengthen Democrats in the 3rd and 10th districts. This district basically goes further east, loses Penn State and stays heavily Republican. McCain probably won 63% of the vote here. Racial stats are 95% White, the whitest district in Pennsylvania. Status is Safe Republican.
District 6 Open (Gerleach) (R) Teal
Trust me; this district is not electing a Republican anytime soon. With Gerleach out, this new district would oust any Republican who might have won in 2010. That will probably not be necessary because the Democrats have some good candidates here. The changes I made were removing most of Chester County while giving the district more of Montgomery County. For good measure, 9% of the district is in Philadelphia. The part it has is 75% African American. I see almost no way for a Republican to win here. Obama probably won 64% of the vote here. Racial stats are 13% African American and 78% White. Status is Safe Democrat.
District 7 Open Joe Sestak (D) Gray
I’m a bit worried about this district because I had to extend it all the way out into Republican areas in Lancaster County. I definitely offset Republican margins from Lancaster by putting in heavily African American parts of Philadelphia in this district. Since Chester County is trending Democratic, this district should stay with the Democrats. Obama probably won 57% of the vote here. Racial stats are 14% African American and 77% White. Status is Safe/Likely Democrat.
District 8 Patrick Murphy (D) Light Purple
All I did here was help shore up Murphy by putting in more of Philadelphia which is now 22% of the district’s population. I also removed part of northern Bucks County. Murphy should be fine now. Obama probably won 57% of the vote here. Racial stats are 86% White. Status is Safe Democrat.
District 9 Bill Shuster (R) Bright Blue
I kept the district pretty much the way it is. All I did was move it east so that it is only a few miles away from Harrisburg. I took in Snyder and Union Counties to help strengthen Chris Carney. Anyway, Shuster is safe in the most Republican district in Pennsylvania. McCain probably won 65% of the vote here. Racial stats are 94% White. Status is Safe Republican.
District 10 Chris Carney (D) Pink
If Chris Carney does not represent this district, he probably lost in a primary, retired or the Republicans found the strongest candidate possible. I took out all the heavily Republican western counties and snaked the district into Northampton County (Bethlehem) and Monroe County which voted for Bush but McCain lost it by 17 points. The rural counties to the north lean Republican but they only gave McCain a combined 6,000 vote margin. The only worry I have is that Dent will run but the Democratic margins from Lackawanna, Luzerne and Monroe Counties should offset Dent’s margins from his old district. With the inclusion of most of Lackawanna County are more of Luzerne, Carney is safe. Obama probably won 55% of the vote here. Racial stats are 87% White and 5% Hispanic. Status is Safe Democrat, Likely Democrat if Dent runs.
District 11 Paul Kanjorski (D) Light Green
I am a bit worried about Kanjorski. I had to shore up other Democrats so he lost a few Democratic areas. I tried to help him by sending his district into Lehigh County (Allentown) which Obama won by 15 points. Republican Charlie Dent who represents the 15th district in Allentown may want to run here. Kanjorski had a tight race in 2008 but if he loses, a strong Democrat will probably beat the Republican who won it. Obama probably won 56% of the vote here. Racial stats are 84% White and 9% Hispanic. Status is Lean Democrat.
District 12 John Murtha (D) Indigo
Due to calling his constituents “racists,” Murtha had a ‘tough’ race in 2008 but won by 16 points. The Republicans probably will challenge him again. I’m not the biggest fan of John Murtha myself but we need as many Democrats as possible and a safe district when he retires. To shore him up, I removed all of Armstrong County and part of Westmoreland County. I added in a slice of Alleghany County, all of marginal Fayette County and Penn State. Murtha should be happy. Obama probably won 52% of the vote here. Racial stats are 92% White. Status is Safe Democrat.
District 13 Allyson Schwartz (D) Tan
I had to change Schwartz’s district quite a bit. First, I took out much of Philadelphia and replaced it with part of Bucks and Northumberland Counties. Since those areas both voted Democratic, Schwartz should be safe. She should worry about a primary challenge from the Bethlehem area but her Philadelphia base should probably keep her in Congress. Obama probably won 58-59% of the vote here. Racial stats are 7% African American, 6% Hispanic and 80% White. Status is Safe Democrat.
District 14 Mike Doyle (D) Algae Green
To help protect Altmire, I had to remove the western part of Pittsburgh from this district and substitute it with more Conservative suburbs to the north and south. They should not be nearly enough to endanger Doyle, he appears safe. Obama probably won 65% of the vote here. Racial stats are 19% African American and 74% White. Status is Safe Democrat.
District 15 Tim Holden (D) Orange
Even though Holden seems pretty safe (he won by 28 points in 2008,) I figured that the Republicans would eventually field a strong candidate against him. To help Holden, I added part of Allentown and removed part of Republican Lebanon County. Holden should have no problem at all now that his district is more Democratic. If Charlie Dent ran here, he would probably lose. Obama probably won 51%-52% of the vote here. Racial stats are 7% African American and 5% Hispanic. Status is Safe Democrat.
District 16 Joe Pitts (R) Light green (in Lancaster County)
I am not completely sure if we can knock off Pitts but we definitely have a good shot at it. I removed some of the rural areas in Lancaster County making the district more centered on the city Lancaster. Even though I included part of Republican Lebanon County, I added more of Democratic Reading. The final blow to Pitts is that even though he loses part of Democratic leaning Chester County, he gets heavily Democratic areas in Delaware County and even a couple of precincts in Philadelphia. This should attract some Delaware County Democrats to run. It should be a tight race because Pitts is pretty entrenched yet his margins are dropping. Obama probably won 52% of the vote here. Racial stats are 9% African American, 14% Hispanic and 73% White. Status is Toss Up.
District 17 No Incumbent (R) Dark Purple
If I were Tim Murphy, I would move to this district and run here. It contains part of his old district and takes in the heavily Republican areas of Butler and Armstrong Counties. Other Republicans will probably aim for this seat but Murphy should probably beat them. McCain probably won 61% of the vote here. Racial stats are 95% White. Status is Safe Republican.
District 18 Todd Platts (R) Yellow (on the southern border)
This district stays basically the same. All I changed was that I shrank the district and added some rural areas in Lancaster. Platts is fine. McCain probably won 59% of the vote here. Racial stats are 89% White. Status is Safe Republican.
I love your PA-16.
Apparently there is some Obama territory in southeast Clearfield. You might want to add that, and remove Blair County from the district.
My intention was to make a much neater-looking map than the atrocious Republican gerrymander we currently have. I had to make some tough decisions: since all of the Republicans except for Dent are in heavily-Republican seats, there was little chance of knocking off any of them, so I decided to oust Kanjorski. The upshot is Carney and Holden have much safer districts now. I also had to make PA-06 more Republican, although it should still lean Dem. But in the process I got PA-07 to be safe Dem.
Unfortunately, western PA is so screwed up that it’s impossible to not make it somewhat gerrymandered, what with Tim Murphy living in an inconvenient spot for his district, and Murtha having to be given a snakelike district, although not nearly as bad as his current one.
The map is probably easier to see if opened in a new window:
PA-01 (dark green, Bob Brady – D) – Super-safe Philly district. Yawn.
PA-02 (dark blue, Chaka Fattah – D) – See above, 51% black.
PA-03 (purple district in the NW corner, Kathy Dahlkemper – D) – Had to expand southward, but shouldn’t have changed the partisan composition much, as I did remove some of the more Republican counties in the district to compensate.
PA-04 (magenta, Jason Altmire – D) – Western half of Allegheny County and its environs; probably a little more Democratic now.
PA-05 (pink, GT Thompson – R) – Safe Republican district, most of the T.
PA-06 (dark red, Jim Gerlach – R) – This is actually better for the Republicans now that it’s most of Chester and all of Berks. Oh well, still 54% Obama or whatever.
PA-07 (yellow one in the SE corner, Joe Sestak – D) – All of Delaware and a bit of Chester, probably close to a safe Dem district now.
PA-08 (yellow-green in the SE corner, Patrick Murphy – D) – Chopped off the top end of Berks and put in some more of Philly. A little more Democratic now?
PA-09 (light purple, Bill Shuster – R) – Actually, this is about the same district as before. Super-safe Republican.
PA-10 (teal, Chris Carney – D) – Takes in Luzerne and Lackawanna and becomes a much more Democratic district.
PA-11 (gold one in between PA-09 and grey, formerly PA-19, Todd Russell Platts – R) – Who? This one didn’t change much either. Safe Republican.
PA-12 (dark purple snake, John Murtha – D) – Okay, I had no desire to keep the Murthamander, but I didn’t want to just give away a district, so I made this intersting little fellow. I was really trying to make the districts more comprehensible than the current gerrymander, but SW PA is all jacked up. Three Congressmen that live in Allegheny County? Seriously?
PA-13 (light purple in the SE, Allyson Schwarz – D) – Nearly all of Montgomery County and is pretty safe.
PA-14 (orange, Mike Doyle – D) – Most of Pittsburgh and the eastern suburbs. Also safe, I would assume.
PA-15 (brown, Charlie Dent – R) – Didn’t change much, but it took the northern end of Berks from Murphy. Should still be around 56% Obama, but I’m sure Dent will hold it until he dies.
PA-16 (grey, Joe Pitts – R) – Mostly unchanged, just weird at the bottom because Pitts lives in Chester, but his district is Lancaster-based.
PA-17 (light blue, Tim Holden – D) – The rest of Kanjo’s district got put in with Holden to make a district that is probably around 50-50, if not a little Dem-leaning now.
PA-18 (green one in the west, Tim Murphy – R) – Yeah, I don’t know why the dude lives outside of Pittsburgh. Anyway, his district is safe R.
So there is this strongly Democratic center of population that’s nowhere near any Democratic districts. In order to put it in a Democratic district, where should it go?
I’ve proposed putting it in the Carney district.
I’ve seen a proposal to put it in the Dahlkemper district.
But after seeing this diary, I now think putting it in the Murtha district is best.
What population numbers are you using for counties/municipalities? If you’re using 2000 census numbers, then I suspect that your Philadelphia-based districts are not feasible. The reason is that Philadelphia has lost population relative to the rest of the state, and will only have the equivalent population of under 2.1 districts (compared to 2.35 districts) in 2010.