With all the talk by Virginia Gov Bob McDonnell about fair redistricting, I thought it would be interesting to make a map that is actually fair. However, instead of just doing a congressional map, I did a State House and State Senate map as well. Do to the fact that it is 150 districts, I will not be giving information on each like i usually do. Instead, i just did a count and classified each district. Any district with less than 45% Obama is Safe R, 45-49.9 is Likely R, 50-53.9 is Lean R, 54-56 is Toss-Up, 56.1-59.9 is Lean D, 60-64.9 is Likely D, 65 and up is Safe D.
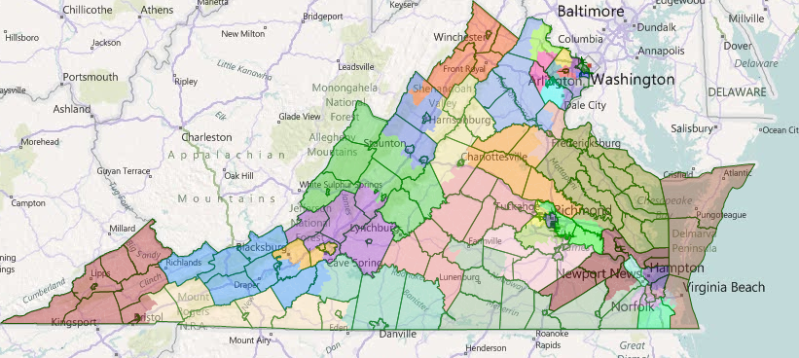
First up, the plan for the Congressional seats.
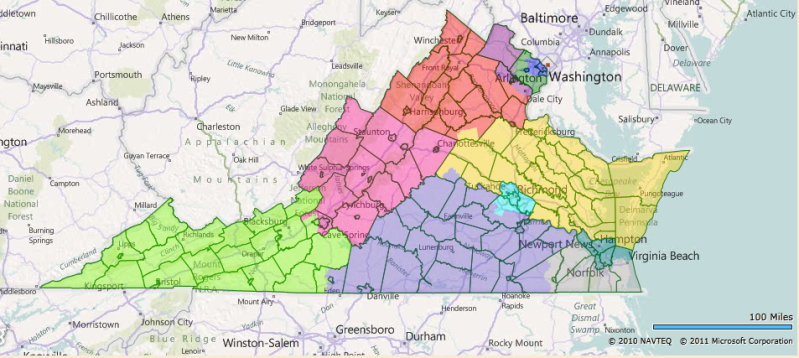
3 Safe R, 3 Likely R, 1 Toss Up, 2 Lean D, 2 Safe D.
That would be 3 Probably R, 2 Probably D, and 3 Competitive seats.
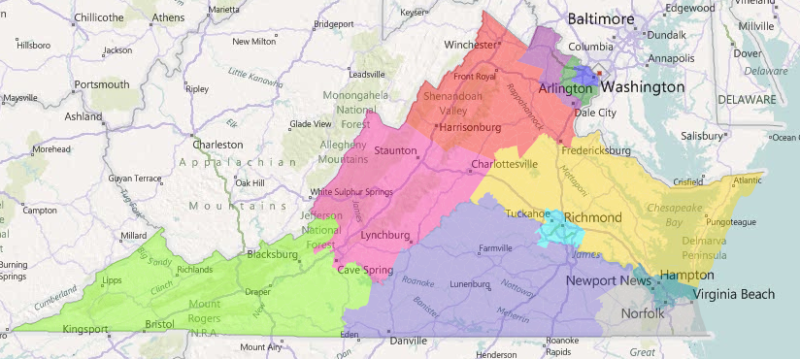
State Senate Plan
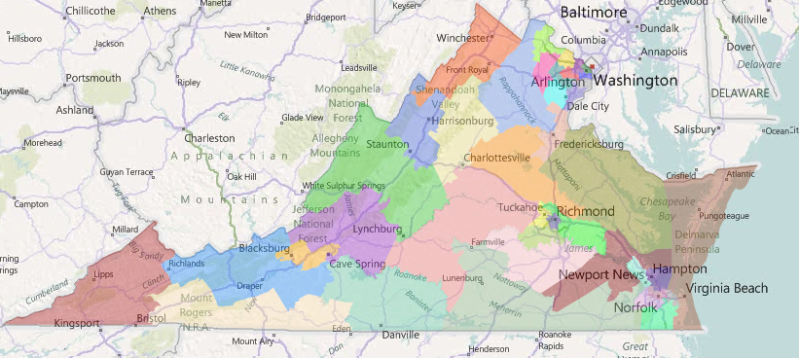

15 Safe R, 3 Likely R, 5 Lean R, 4 Toss-Ups, 2 Lean D, 7 Likely D, 4 Safe D.
That would be 18 Probably Republican, 11 Probably Democrat, and 11 Competitive.
State House
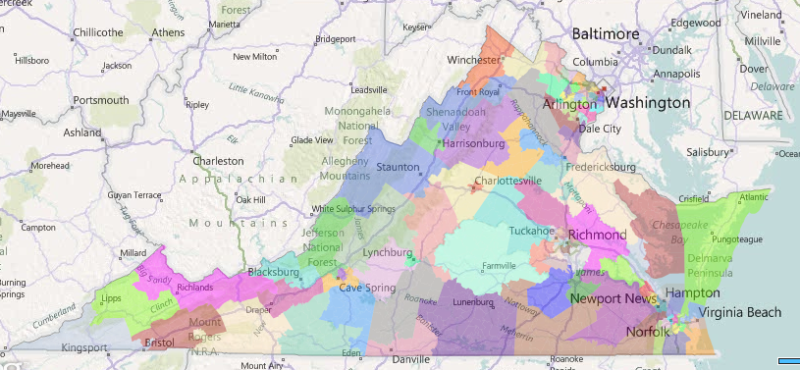
31 Safe R, 16 Likely R, 8 Lean R, 9 Toss-Ups, 10 Lean D, 12 Likely D, 14 Safe D.
47 Probably Republican, 26 Probably D, 27 Competitive.
My initial reaction was one of surprise, as I thought the seat count would be more even. But as I thought about it, Virginia was closer than the nation as a whole, so if we use the nation as a whole as the way to determine how safe a district is, we of course get this result. If you assume 08 is closer to the truth, dems would win almost all of the “competitive” districts. If we assume it is more like 2010, than those would go to republicans. If you want more info on any districts or VRA or any of that good stuff, lemme know.
The dems would probably be pretty happy.
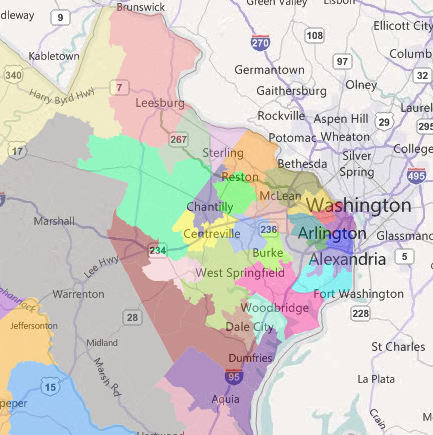
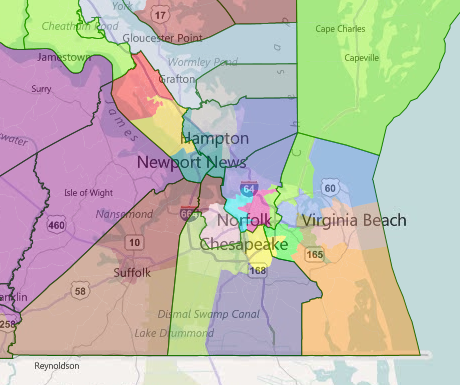
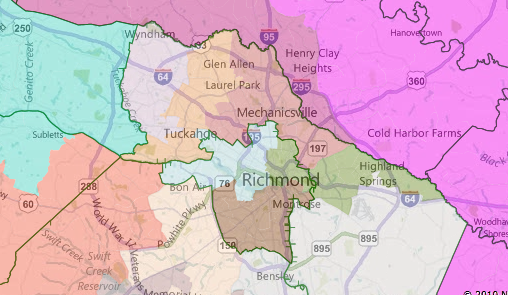
How are you only getting 2 probably Dem seats in the congressional map? It looks like 4 Dem to me. The two inner NoVa seats, the Hampton Roads one, and the Richmond one.
What are the stats on the gray seat, Obama/McCain wise?
I think that the way you’v done your classification skews the results Republican. Districts that Obama won leaning Republican? …
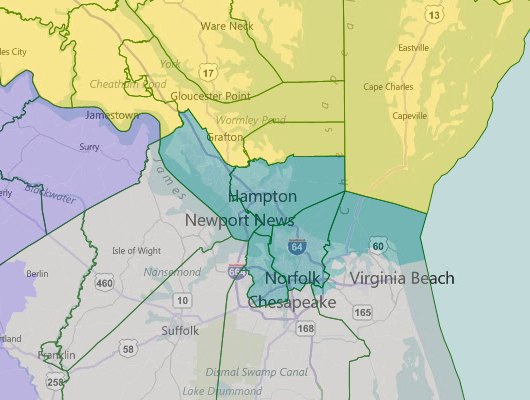
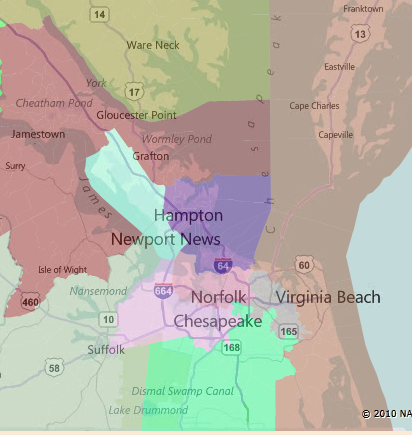
Your Hampton-Newport News district looks like it would be able to pass the VRA, I would presume it would give African-American voters an opportunity to elect a candidate of choice.
I also like that Cantor is basically given all of Richmond. He could move to the yellow district and challenge Whitman or to the red district, but that one is a bit far out of range and he may not win a primary.
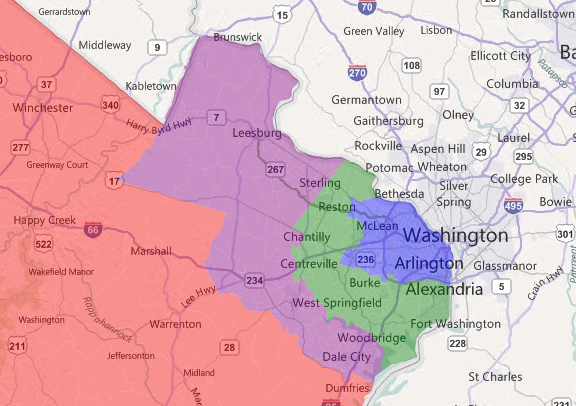
Frank Wolf looks a little less safer, but I presume he could handle that seat, but if it was open, the Democrats would have a chance.