This diary explores the following alternate reality: What if the US Senate was apportioned like the US House? One hundred members, single-member districts, distributed just like House seats (ie, every state gets one seat and then the rest are apportioned using the rule of equal proportions.)
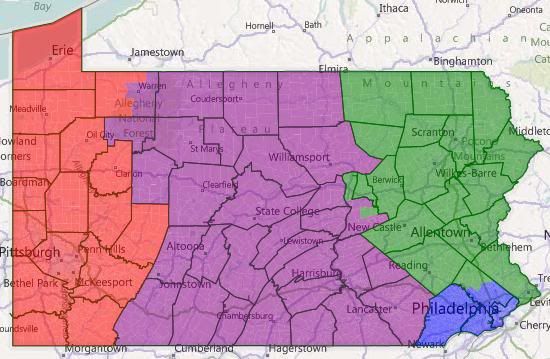
Using 2010 data, the map would look like this:
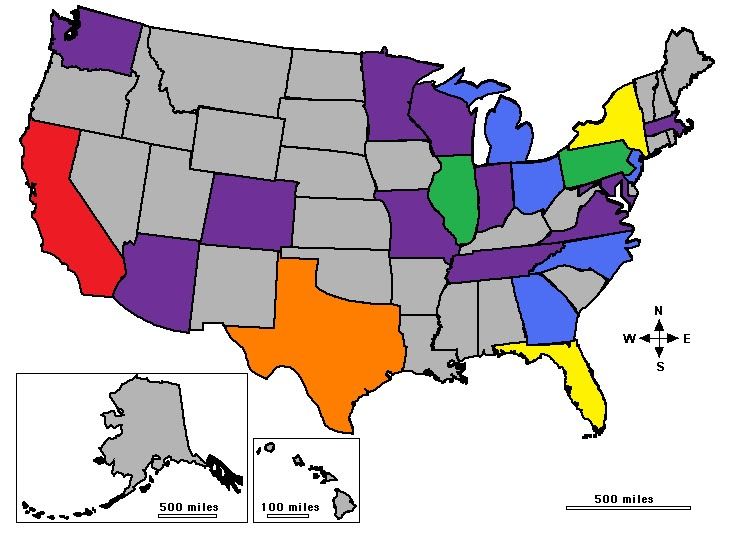
California, in red, would have 10 seats. Texas, in orange, would have 7. New York and Florida, in yellow, would have 5. Illinois and Pennsylvania, in green, would have 4. Georgia, North Carolina, Ohio, New Jersey, and Michigan – all in blue – would have 3. Eleven other states, in purple, would have their current 2. And the remaining twenty-eight states, in grey, would be down to 1.
Two seats would have moved as a result of the 2010 Senate reapportionment, with Texas and Colorado gaining at the expense of Ohio and New York.
(Figures are from the Census Bureau. Since we’re doing this just like the House, all you have to do is look at the House priority lists and cut it off at 100 instead of 435. See here for the 2010 data and here for the 2000 data.)
After the jump, I have maps for the 22 states that would have more than one senator in this alternate universe. Please feel free to post your own.
I’d also be very interested to hear who you all think would be in the senate in this alternate universe. I’m having a hard time figuring out how the one-third-at-time-up-for-election rule would work in a reapportioned body, so perhaps in the alternate universe, senators have four year terms and are elected at presidential midterm? That’s not a fixed rule for this hypothetical, just a guess.
Notes: The presentation of maps for states with more than one senator is sorted according to number of senators, then alphabetically. There’s a brief round up of the one-senator states at then end.
I’ve used the default colors throughout, so blue = CD-1, green = CD-2 purple = CD-3, red = CD-4, yellow = CD-5, teal = CD-6, grey = CD-7, slate blue = CD-8, cyan = CD-9 and pink = CD-10.
I’ve assumed that a compactionist ethic would be at play, and that minority opportunity districts would be favored, even if they’re not 50%+. Obviously, that’s another part of the alternate universe.
States with 3 or more senators
AKA those disadvantaged by the current system
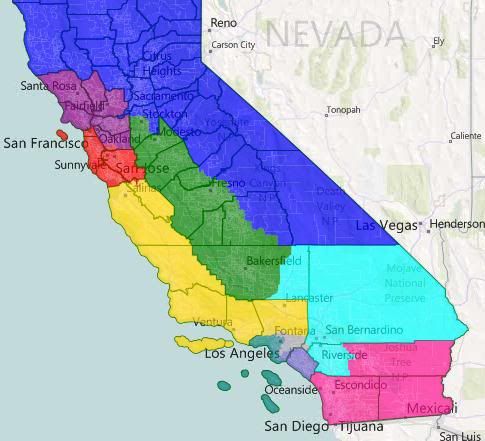
California
Overview
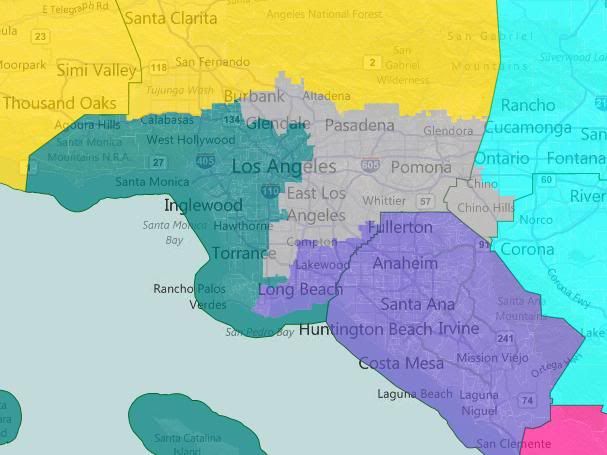
LA Detail
California has ten districts: (CD-1) North CA/Sacramento/Sierra Nevada, (CD-2) Central Valley, (CD-3) North Bay, (CD-4) South Bay, (CD-5) Central Coast, (CD-6) East LA County, (CD-7) West LA County, (CD-8) Orange County/Long Beach,
(CD-9) Inland Empire, and (CD-10) San Diego/Salton Sea.
CD-1 is the only one that’s majority-white by total population. CD-2, CD-5, CD-6, and CD-9 are plurality Hispanic. CD-07 is majority Hispanic.
My guess is that CD-3, CD-4, CD-6, and CD-7 would be safe Democratic, with the rest being some form of competitive (ie, between lean Dem and lean Rep). Say for the sake of argument that we would be holding two of them right now. That starts our running total at 6 D – 4 R.
Note: the voting block shapes for CA can be pretty large right now in Dave’s App. CD-6 is about 50k under populated with CD-07 about 50k over populated. If I swap the LA proper parts of CD-8 back to CD-6, that swaps to CD-8 being 30k under and CD-6 being 30k over. So, about half of that southern part of LA proper needs to go back to CD-6. For a fictional scenario, I figure this was an ok kludge.
Texas
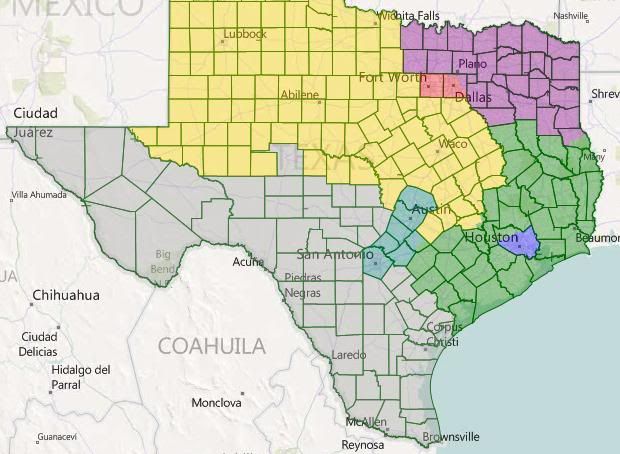
Texas has seven seats: (CD-1) Harris, (CD-2)Southeast Texas, (CD-3) Northeast Texas, (CD-4) Metroplex, (CD-5) North and Central Texas, (CD-6) San Antonio/Austin, and (CD-7) South Texas.
CD-7, of course, is heavily Hispanic. CD-1 is plurality Hispanic, and CD-4 and CD-6 are only plurality white.
I would think that CD-1 and CD-6 are easy gets for us, with CD-4 and CD-7 leaning our way. The other three are ubersafe for the GOP. Running total: Dem 10, Rep 7.
Florida
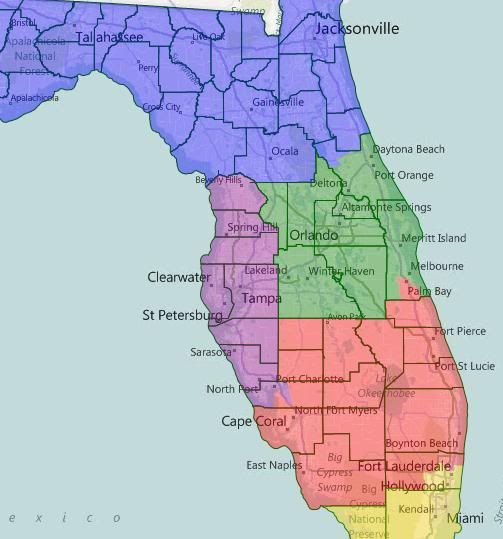
Five districts: CD-01 North Florida, CD-02 North Central Florida, CD-03 West Central Florida, CD-04 South Central Florida, CD-05 South Florida.
CD-05 is majority Hispanic, the rest majority white.
I’d like to think that these are all at least potentially competitive, but I’m going to be conservative here and say that we only hold one of these (Nelson in Orlando?). Running total: Dem 11, Rep 11.
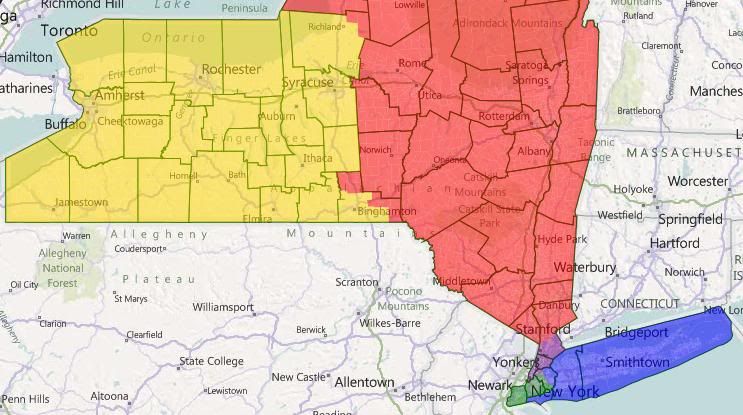
New York
Overview
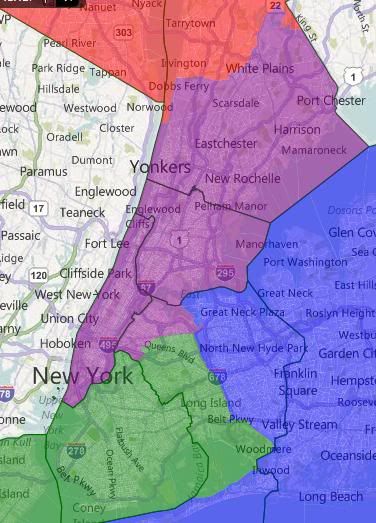
NYC Detail
Five districts: CD-01 Suffolk/Nassau/NW Queens, CD-02 Brooklyn/Staten Island/South Queens, CD-03 Manhatten/Bronx/Northwest Queens/South Westchester, CD-04 East Upstate, CD-05 West Upstate.
I forgot to save this map, so I don’t have racial stats. CD-02 and CD-03 were majority minority, I think.
Partisan breakdown here depends on whether 2010 factors into the equation. In a normal environment, I think CD-04 is the only truly vulnerable district, but we’ll spot the GOP CD-05 as well. Running total: Dem 14, Rep 13.
Illinois
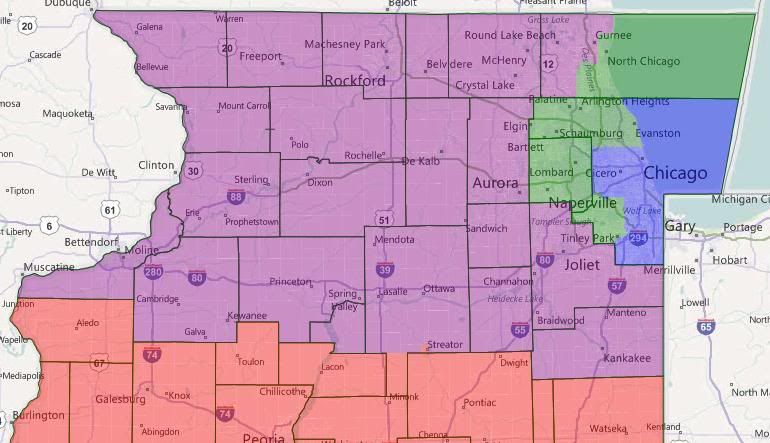
CD-01 Chicago, CD-02 Suburban Chicago, CD-03 Northern Illinois, CD-04 Southern Illinois. CD-01 is plurality black at 35% or so. The rest majority white. I’m going to call this a 2-2 split, so running total: Dem 16, Rep 15.
Pennsylvania
CD-01 Philadelphia, CD-02 Northeast PA, CD-03 Central Pa, CD-04 West PA. All majority white. I’m going to call this one a 2-2 split also, so running total Dem 18, Rep 17.
Georgia
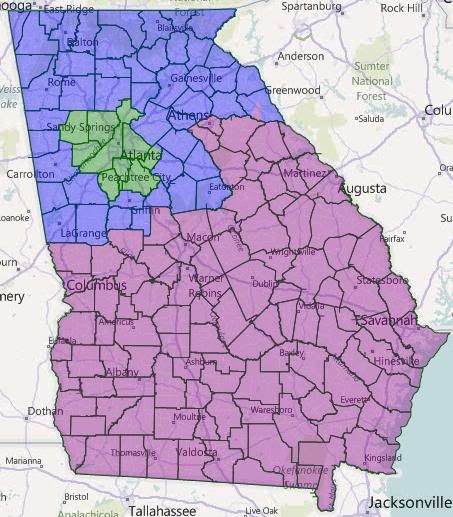
Three districts: CD-01 North Georgia, CD-02 Atlanta, CD-03 South Georgia.
Atlanta is plurality white and about 40% black, the rest are majority white.
I assume we’d take Atlanta and Republicans would get the other two. Running total: Dem 19, GOP 19.
Michigan
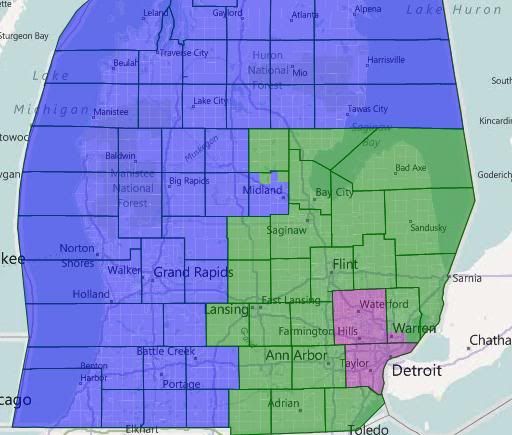
Three districts: CD-01 North and West Michigan, CD-02 Southeast Michigan, CD-03 Wayne/Oakland/South Macomb.
Looks like I forgot to save this map too. I’m pretty sure they’re all majority white.
CD-02 and CD-03 are safe Democratic (and would probably be represented by Stabenow and Levin, respectively.) CD-01 is likely Republican. Running total: Dem 21, GOP 20.
New Jersey
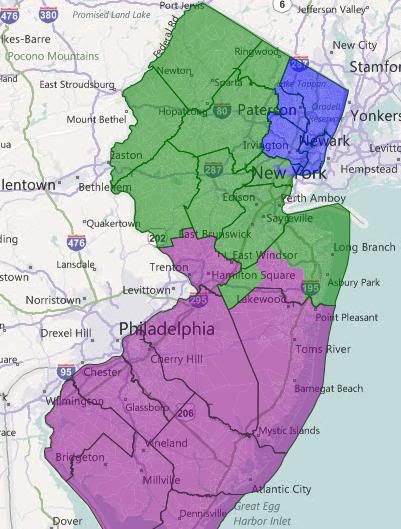
Three districts: CD-01 Greater Newark, CD-02 North Jersey, CD-03 South Jersey.
CD-01 is white plurality, the other two white majority.
I know a lot of Democratic strength is locked-up in CD-01, but we’d still be likely to hold at least two of these, right? Running total: Dem 23, GOP 21.
North Carolina
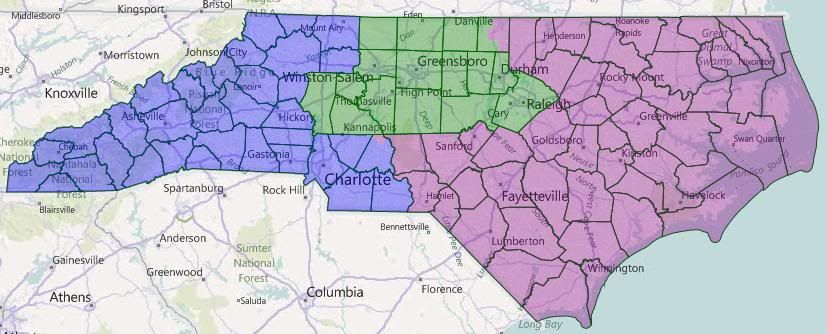
CD-01 Charlotte/West Carolina – Likely Republican?
CD-02 Triangle and Triad – Likely Dem
CD-03 East Carolina – Toss-up?
All are majority white; CD-03 has the highest black percentage at 27%. I’m going to give us a Blue Dog-ish Dem in the east, so running total: Dem 25, Rep 22.
Ohio
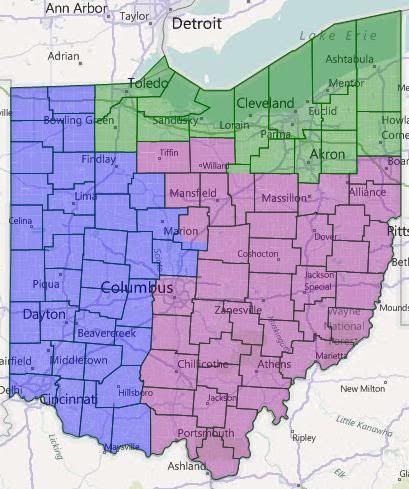
CD-01 West Ohio, Likely R
CD-02 North Ohio, Safe D
CD-03 Central and SE Ohio, Tossup?
All majority white. I’ll throw the R’s a bone here and call the running total: Dem 26, Rep 24.
Note that these eleven states account for half the senators in the alternate universe.
States with Two Senators
AKA the status quo
No geographic breakdowns anymore, I’m too tired. Remember, Blue = 1 and Green = 2.
Arizona
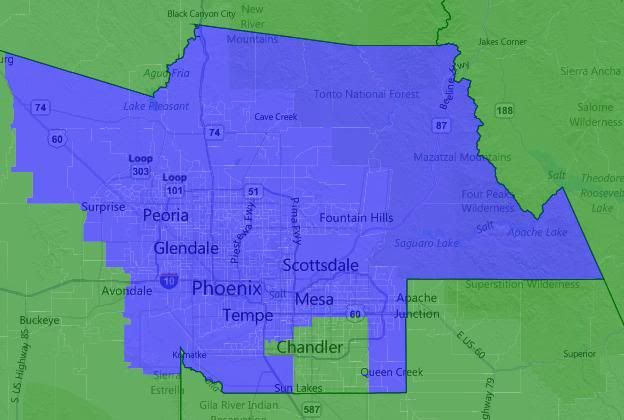
Both majority white at 58%. I have no idea if splitting Arizona between Maricopa and outstate helps us. I’ll assume not. Running total: Dem 26, Rep 26.
Colorado
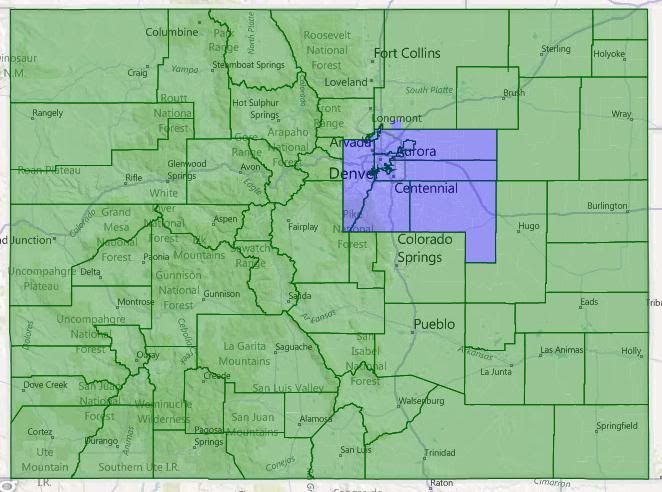
I assume that cutting out Denver is bad for us. Running total: Dem 27, Rep 27.
Indiana
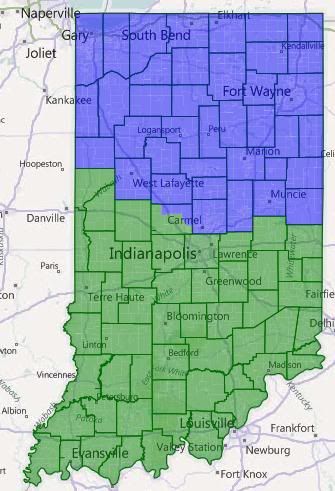
I could see both of these being competitive under the right circumstances. I’m going to give us the northern one. Running total: Dem 28, Rep 28.
Maryland
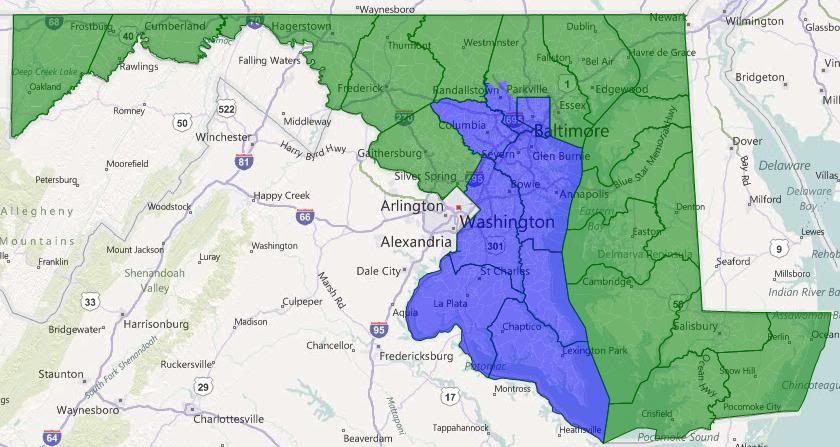
CD-01 is plurality black at 45%; this makes the other district more competitive than it ought to be. I still think we take both. Running total: Dem 30, Rep 28.
Massachusetts
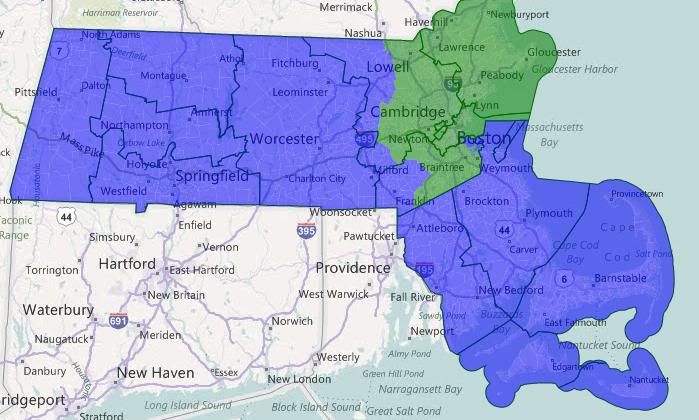
Let’s go ahead and assume Scott Brown. Running total: Dem 31, Rep 29.
Missouri
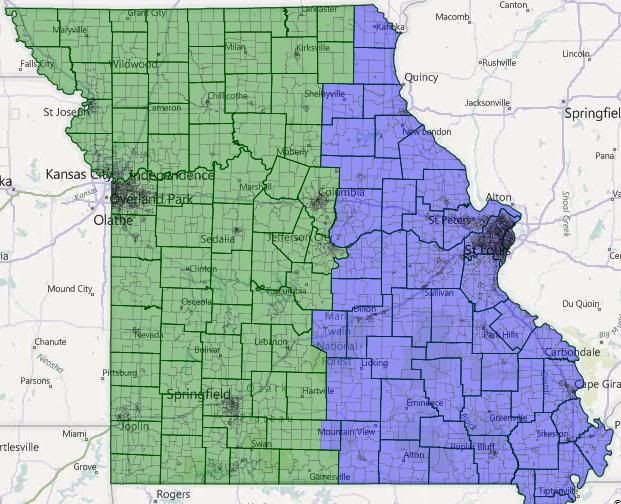
No idea what the ramifications of splitting Missouri are. I’m calling it split. Running total: Dem 32, Rep 30.
Minnesota
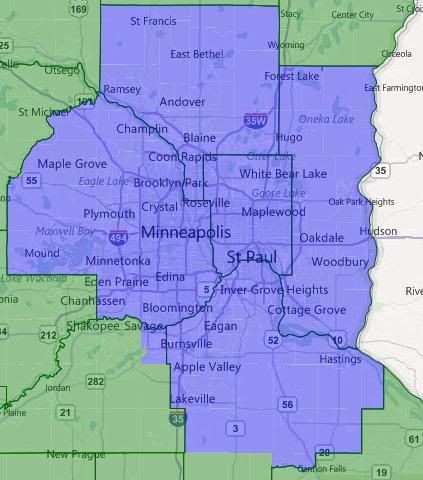
I assume we can hold both of these? Running total: Dem 34, Rep 30.
Tennesee
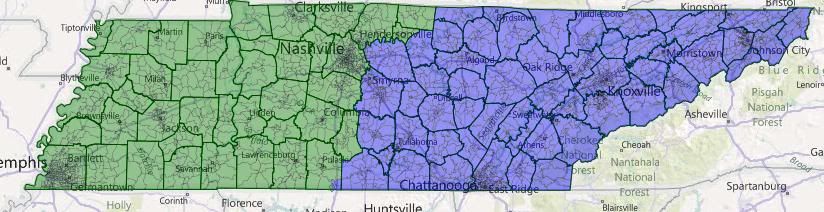
CD-01 is safe GOP. I could see us competing in CD-02. But running total: Dem 34, Rep 32.
Virginia
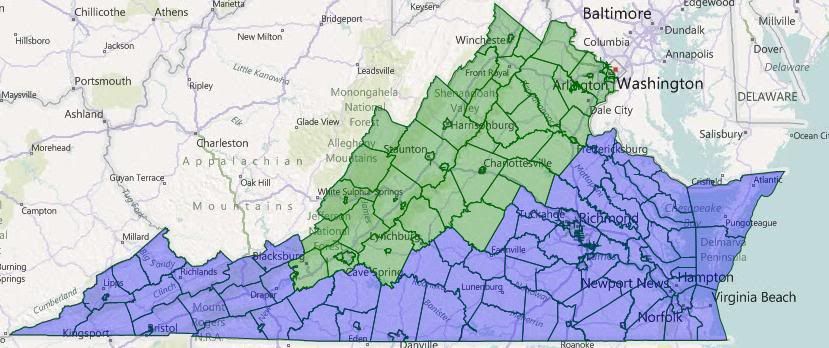
I’m not happy with this division, but everything else looked worse. Both districts should still be winnable for us, so running total: Dem 36, Rep 32.
Washington
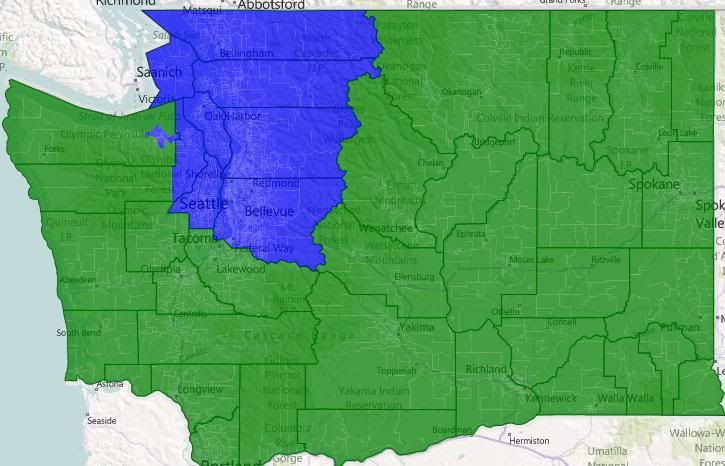
Probably the state where the split harms us most, unless Tacoma and Olympia can outweigh the rest of the state. I’m calling it split, so running total: Dem 37, Rep 33.
Wisconsin
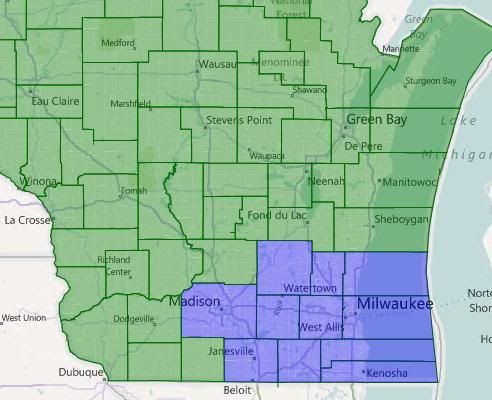
Madison and Milwaukee versus the Circle of Ignorance! The rest of Wisconsin looks on… I’m giving us both, so running total Dem 39, Rep 33.
The Single Senator States
AKA The unfairly advantaged
The remaining 28 states currently have almost enough votes to sustain a filibuster; in the alternate universe, they don’t even have enough to block one.
Northeast
I’d give us Delaware, Vermont, Connecticut, and Rhode Island. Maine and New Hampshire are probably toss-ups, so I’ll get us one of them. Running total: Dem 44, Rep 34.
South
They get Alabama, Mississippi, Kentucky, Oklahoma, and South Carolina. We get West Virginia. And I’ll split Arkansas and Louisiana. Running total: Dem 46, Rep 40.
Midwest
They get Kansas. I’ll split Iowa, Nebraska, and the Dakotas. Running total: Dem 48, Rep 43.
West
We get Oregon, New Mexico, Hawaii and Montana. They get Wyoming, Idaho, and Utah. That leaves splitting Nevada and Alaska. Final total: Dem 53, Rep 47.
Conclusion
Ok, that’s bizarre. I totally didn’t set out to end up where we actually are, it’s just where my guesses lead. Even if my take on this particular exercise didn’t show any partisan bias to the set-up of the Senate, it does highlight just how undemocratic that body is.
Again, please feel free to chime in about who you think would be in office in the alternate universe or to show off your (more gerrymandered?) versions of the alternate universe’s Senate districts.
Is pure, unadulterated villainy of the first order.
That being said, great work on this. I disagree on some of your conclusions, but it’s an interesting thought experiment.
FWIW, there is virtually no doubt that the green Triangle/Triad district on your North Carolina map would be Democratic. That is far more assured than a blue-dog winning the Coast.
before myself. It would probably finally ensure continuous–and roughly proportional–black representation in the Senate. I’ve never run the numbers before, though.
Anyway, as to your assumed divisions: I think you were too generous with your assumptions to Democrats in some places (i.e., New York) and not enough in others (Florida). The upshot is that I think your final count isn’t far wrong. But what the numbers don’t capture is that the new Democratic caucus would almost surely be much less conservative than the existing one. That’s because this system goes a long way (though not all the way) towards addressing a grotesque rural bias in the existing Senate.
I’d like to know what your assumptions are for your ratings. It can’t really be a “neutral year” because then it would be 50-50 or a small GOP majority.
I don’t know the partisan tendancies of the Texas districts but 4-3 Dem seems like it would be hard to get without a pro-Dem gerrymander.
exactly how much would this address inequality? What is the standard divisor? Population variance? Biggest district? Smallest district?
I would have assumed that all senators would be statewide, even in places like California where there would have to be 10 statewide seats (plus governor, etc.). As far as senate elections go, why not stay with six-year terms? Here’s how it could work: States with more than three are divided up as evenly as possible: Calif 3-3-4, TX 3-2-2, Fl 1-2-2, NY 2-2-1, Illinois 2-1-1, Penn 1-2-1, with a running total of 10-10-9. The five states with three would be even for a running total of 15-15-14. The 11 states with two would be divided up similar to the way states are now, with no state having two up at once, for a running total of 22-22-22. The last 28 states with only one would be divided up as evenly as possible to get the total up to 33 one year, 33 two years later, and 34 two years after that. I like that better because the senate is constitutionally supposed to be more immune to short-term trends, whereas if they were all elected every four years it would go back and forth from like 65-35 one way and then back the other way. The senate is also supposed to represent the states, so that’s why I thought they should all be statewide. Here I’m compromising with the Connecticut compromise…. =] if you know what I mean.
Anyway, if you assume that all the states that currently have two senators of the same party would have senators of that party in this method, then you have 67 senators easily decided, and they would go this way: 26 R and 41 D, although I think the case could be made that a few of those Dems, like Montana’s lone senator, or one or both of Virginia’s two senators, or WV’s senator, etc. might be Republicans–but for the purpose of this exercise, we’ll assume that the current senators from those states would run and could win. Then, there are 33 states that right now have a divided senatorial representation. I’ll go through each, and decide what would most likely occur:
Alaska’s lone senator: R
Arkansas’ lone senator: R (not sure?)
Florida’s five senators: I’ll go with 3 R, two D
Illinois’s four senators: 3 D, 1 R, assuming Kirk could win.
Iowa’s lone senator: D, just to offset Arkansas, which I’m having similar problems deciding.
LA’s lone senator: R
Massachusett’s two senators: Alright, Scott B., I’ll give you a seat, as much as I’d like not to: 1 R, 1 D
Missouri’s two senators: We’ll keep the current representation: 1 R, 1 D
Nebraska: 1 R
Nevada: Hmm. Harry Reid could win this race, I think: 1 D
New Hamp: Hmm, again. I’m going to sat 1 R, to offset Nevada
N.Carolina: 2 R, 1 D
N. Dakota: 1 R
Ohio: 1 R, 1 D
PA: I hate Pat Toomey, but I think a moderate Republican could win Pennsylvania under normal circumstances (but not him): 3 D, 1 R
S. Dakota: 1 R
WI: 1 R, 1 D (to keep the status quo)
So. Where does that leave us? 44 Republicans, 56 Democrats. I kind of like this representation!
You threw in some Dem parts of Lake Co. and a few Dem areas like Evanston, but you added all of DuPage County and the most Republican parts of Cook County. Your IL map would likely go 3-1 Republican in a D+8 state, which should immediately silence anyone whining about Democratic gerrymanders or whatever.
Conversely, however, I think your red district in PA would go Dem. You have all of Allegheny and Erie Counties, and some counties in the district that vote R for president, such as Butler and Fayette, voted for Casey in 2006 by more than his statewide margin. Casey or a similar candidate could win that district for sure.
I think the out-state Senator would be much more likely to be Republican. The Dems would have Duluth, but the Republicans would have the ex-urbs and the rural areas (Mankato and Rochester are swingy)
Jerry Brown, circa his run against Pete Wilson, running here instead? Tom Bradley? Antonio Villagrosia? Sheila Kuehl? Maxine Waters? Someone named Hahn?
If you are going to do it this way, you might as well just disband the Senate (or greatly diminish it’s power compared to the House).
On a different note, it’s times like this I wish DRA would let us cross state-lines, I’d love to remake the entire United States to make 50 states that are a lot closer to each other in population (and as Democratic as possible, I’d love to create a few majority-black states in the south!)
Obama vs. McCainnumbers are very skewed here. For example, Joe Walsh’s district is really about R+3.5 (in my opinion), and Bob Dold’s is About D+2.5. The suburban district would be swingy, but would lean R due to DuPage county, and the mostly Republican areas of Cook you’ve added.
Also, that green Maryland district would be a toss-up, and I think maybe around R+1. It contains Andy Harris’ CD, the GOP parts of Ruppersberger’s, as well as Roscoe Bartlett’s CD. Chris Van Hollen’s district would also be in here, but that would bring the PVI back down to around even, in my opinion.
And kudos for taking the time to actually crunch the numbers. One thing I’ve always considered interesting would be if the U.S. had a unicameral legislature and the House was expanded, (maybe to five-hundred thirty-eight members) but I’m too damn lazy to actually do the math.
And I agree with some of the other commentators above; I think PA would be 3-1 Dem in most years, especially if you swapped Cambria County for some of the northern central counties in PA-04.
I would not be so quick to give both VA Senate Districts to Dems. Although both would be competitive, the “South Virginia” district would be more amenable to Republicans. It just barely went to Obama (50.7-49.3), but average is 52-48 GOP. “North Virginia” is 52.8-47.2 Obama and average is 50.2-49.8 for Dems (but see below).
Can some one with a better understanding of Dave’s Redistricting app help me with a question? I recreated the 2 Senate districts from this thread and I am not missing any precints. I get a total Obama vote of 1,653k whereas the Virginia SBE gives Obama’s total as 1,960k (McCain’s totals are 1,543k in Dave’s App and 1,725k per Virgina SBE). Where are the missing votes? Could it be due to absentee ballots? Depending on how the missing 307k Obama votes and 182k McCain votes were distributed, McCain may very well have won “South Virginia”.
25, Male, VA-07 (Currently in France)
for Texas. What a beautiful Dem gerrymander that would be.
Dems would dominate the south texas district, the San An/Austin District, the Houston district (because you take out the Republican NW suburbs, and probably take the Dallas district as you are sparing it the heavily R western suburbs of Fort Worth.
Those green yellow and purple district have probably less than 100k votes for Obama in them, combined. A republican map would divide the san/an and austin district and would surely have the purple district take in some south Dallas precints to make it more republican. Also, they would probably put most of east houston in the green district and stretch the Houston district into the N and NW suburbs, making it republican.
Basically, the R’s would surely only give us one dem district, and that would the the S. Texas one. This map is so beautifully gerrymandered for the dems it makes me want to weep with joy. I wish it would come true.
The rest of the map is most assuredly an R gerrymander, as you are simply taking cities and sequestering them to one mega dem ‘senate’ district, while letting republicans run free in R+5/7 ‘big’ districts.