This is a part of a series of posts analyzing the 2010 midterm elections. This post will discuss the 2010 Florida gubernatorial election, which Republican candidate Rick Scott won in an extremely close contest.
Florida’s Gubernatorial Election
On November 2010, Democrat Alex Sink faced an extremely flawed Republican opponent: multimillionaire Rick Scott, a businessman accused of heading the biggest fraud in Medicare history.
Ms. Sink still lost, running in a Republican leaning state in a very Republican environment. Here is what happened:
More below.
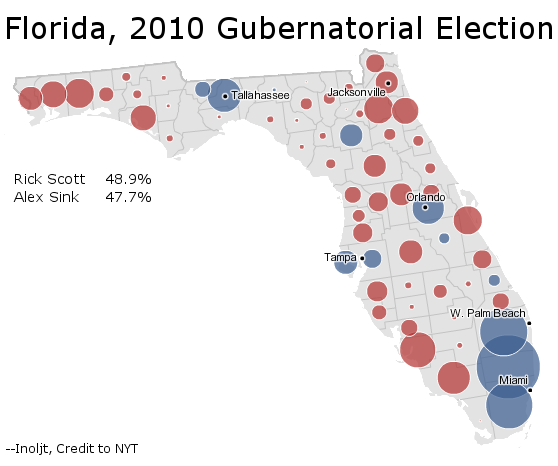
This constitutes a classic map of a close race in Florida. Ms. Sink wins the counties that she needs to win in the I-4 central corridor. For a Democrat, she performs relatively strongly in conservative northern Florida.
Turn-Out
What kills Ms. Sink, however, is Democratic turn-out.
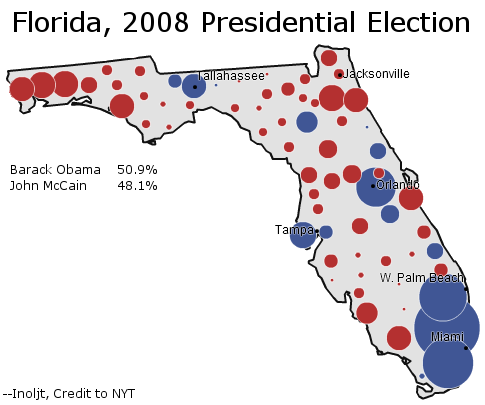
To gain some perspective on this, let’s compare Ms. Sink’s performance with that of President Barack Obama’s:
Note that the circles depicted here are not equivalent. In 2008 8.4 million people voted; in 2010 only 5.3 million did. So the absolute margins of 2008 – regardless of whether Mr. Obama won or lost the county – are much bigger.
Nevertheless, one can see that Mr. Obama gets quite a bit more mileage out of the counties he wins than Ms. Sink does. This is especially true along the Democratic, minority-heavy strongholds of Orlando and South Florida.
In 2008 these places composed a greater share of the Florida electorate than they did in 2010; minority and Democratic turn-out fell disproportionately in the mid-term. In 2008 Orlando and South Florida (i.e. Broward, Miami-Dade, Orange, and Palm Beach counties) composed 31.6% of the electorate; in 2010 they composed 29.2% of the electorate. This does not seem like much, but it makes a difference when the margin of victory is 1.2%.
On a county-by-county basis, Mr. Scott’s margin would be cut from 61,550 to 15,226 in the 2008 electorate, even if his share of each county’s vote does not change (only the number of voters in each county does). I suspect that if you adjust this on a precinct level – if you give each precinct the same number of voters it had in 2008, without changing the percent of the vote Ms. Sink and Mr. Scott got in that precinct – Ms. Sink would have won outright.
Turn-Out
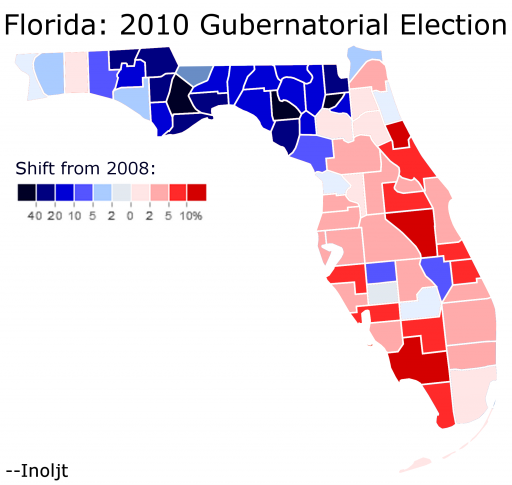
There is one part of Florida, however, in which Ms. Sink did much better than Mr. Obama. It’s hard see this in the previous maps, due to the low population of this region. Here is a better illustration:
As the map indicates, Northern Florida moved quite strongly towards Ms. Sink, although not strongly enough to offset her losses elsewhere.
There are a variety of explanations for why this might be. The rural, poor, Southern voters there might have been turned off a wealthy businessman as a Republican candidate. Ms. Sink might have overperformed amongst Republicans.
It is also true that Mr. Obama did quite poorly amongst these voters, losing many of these counties by 40+ margins. Partly this had to do with his status as a big-city Chicago liberal. Mostly, however, Mr. Obama did poorly because he was black.
Half a century ago northern Florida was the most Democratic part of the state, back in the days of the Solid South. Since then the Democratic Party has moved away from these voters (see: John Kerry, Barack Obama); it gets progressively harder each election for a Democrat to win them, although some still do. Ms. Sink’s improvement over Mr. Obama, then, might have been the last gasp of a dying breed: white Dixie Democrats.
Conclusions
In the dying days of Florida’s gubernatorial campaign, Democratic candidate Alex Sink was accused of cheating during the gubernatorial debate. The scandal broke during the final days of the campaign, derailing a crucial time for any campaign. Pundits will point to the scandal as responsible for the 1.2% margin by which Ms. Sink lost.
Yet it may have been another event, seemingly unrelated, that truly undid Ms. Sink. During the campaign’s final days, Independent Charlie Crist – running for Florida’s Senate seat – mounted a concerted effort to get Democrat Kendrick Meek to drop-out. The coverage dominated national news, blackened the image of both participants, and demoralized Democrats everywhere in Florida.
It may have also led to Ms. Sink’s defeat. In many ways the candidate did what she had to do – she won the right places and improved on Mr. Obama in the most Republican part of Florida. I remember looking at her northern Florida numbers on election day and feeling somewhat optimistic about her chances. With the vote in at 50%, Ms. Sink stood behind by 5% – but the Democratic Gold Coast hadn’t started reporting. She could close things once the Democratic strongholds Palm Beach, Broward, and Miami-Dade counties came in.
But Ms. Sink never did fully close the gap. Democratic turn-out killed Ms. Sink, as it did with many others in 2010.
–Inoljt
P.S. Here is a table I created, some of whose information is used in this post.
| Republican Margin: Change from 2008 to 2010 | 2010 County Percent of Vote | 2008 County Percent of Vote | Change in Turn-Out | Sink Under 2008 Electorate | County |
| 0.11% | 1.38% | 1.50% | -0.12% | -26919 | Alachua |
| -29.35% | 0.15% | 0.13% | 0.02% | 3091 | Baker |
| -2.73% | 1.03% | 0.97% | 0.06% | 30805 | Bay |
| -17.09% | 0.15% | 0.14% | 0.01% | 2706 | Bradford |
| 2.87% | 3.66% | 3.43% | 0.23% | 38254 | Brevard |
| 3.50% | 7.83% | 8.74% | -0.90% | -229201 | Broward |
| -32.24% | 0.08% | 0.07% | 0.01% | 504 | Calhoun |
| 6.87% | 1.11% | 1.02% | 0.09% | 12047 | Charlotte |
| -0.81% | 1.02% | 0.91% | 0.11% | 11629 | Citrus |
| 0.12% | 1.19% | 1.13% | 0.06% | 40617 | Clay |
| 10.14% | 1.92% | 1.69% | 0.23% | 46331 | Collier |
| -12.40% | 0.35% | 0.34% | 0.02% | 6001 | Columbia |
| -1.01% | 0.13% | 0.12% | 0.01% | 1146 | Desoto |
| -30.47% | 0.10% | 0.09% | 0.01% | 1047 | Dixie |
| 3.81% | 4.88% | 4.95% | -0.07% | 23793 | Duval |
| -0.78% | 1.79% | 1.84% | -0.05% | 28636 | Escambia |
| 11.39% | 0.62% | 0.59% | 0.04% | 4833 | Flagler |
| -28.01% | 0.08% | 0.07% | 0.00% | -10 | Franklin |
| -7.45% | 0.31% | 0.27% | 0.04% | -10451 | Gadsden |
| -18.49% | 0.10% | 0.09% | 0.01% | 2214 | Gilchrist |
| -0.63% | 0.05% | 0.05% | 0.00% | 832 | Glades |
| -15.77% | 0.09% | 0.09% | 0.01% | 1693 | Gulf |
| -13.24% | 0.07% | 0.07% | 0.01% | 75 | Hamilton |
| -5.83% | 0.10% | 0.09% | 0.01% | 1761 | Hardee |
| 5.24% | 0.12% | 0.13% | -0.01% | 1354 | Hendry |
| 4.90% | 1.09% | 1.05% | 0.04% | 7458 | Hernando |
| 2.20% | 0.56% | 0.53% | 0.02% | 9074 | Highlands |
| 3.79% | 5.93% | 6.12% | -0.19% | -17133 | Hillsborough |
| -24.68% | 0.11% | 0.10% | 0.01% | 3460 | Holmes |
| 6.92% | 0.88% | 0.84% | 0.04% | 15364 | Indian River |
| -24.48% | 0.28% | 0.26% | 0.02% | 754 | Jackson |
| -14.85% | 0.12% | 0.09% | 0.02% | -1476 | Jefferson |
| -43.33% | 0.05% | 0.04% | 0.01% | 574 | Lafayette |
| 2.61% | 1.90% | 1.75% | 0.15% | 23697 | Lake |
| 11.33% | 3.39% | 3.21% | 0.19% | 58504 | Lee |
| -11.04% | 1.86% | 1.77% | 0.09% | -52485 | Leon |
| -5.68% | 0.24% | 0.22% | 0.01% | 3976 | Levy |
| -45.26% | 0.04% | 0.04% | 0.00% | -43 | Liberty |
| -10.71% | 0.12% | 0.11% | 0.01% | -680 | Madison |
| 5.42% | 1.98% | 1.81% | 0.17% | 18952 | Manatee |
| 2.02% | 2.13% | 1.93% | 0.20% | 22073 | Marion |
| 2.07% | 1.01% | 0.93% | 0.08% | 12257 | Martin |
| 1.82% | 9.11% | 10.28% | -1.17% | -123556 | Miami-Dade |
| 5.01% | 0.49% | 0.48% | 0.01% | 48 | Monroe |
| -4.23% | 0.50% | 0.46% | 0.04% | 15161 | Nassau |
| 0.69% | 1.14% | 1.14% | 0.00% | 43580 | Okaloosa |
| -5.99% | 0.15% | 0.15% | 0.00% | 1684 | Okeechobee |
| 7.48% | 5.07% | 5.50% | -0.43% | -51546 | Orange |
| 13.29% | 1.00% | 1.20% | -0.20% | -6459 | Osceola |
| 4.16% | 7.15% | 7.03% | 0.12% | -110658 | Palm Beach |
| 4.88% | 2.55% | 2.56% | -0.01% | 18217 | Pasco |
| 2.55% | 5.66% | 5.53% | 0.13% | -26374 | Pinellas |
| 4.83% | 2.99% | 2.92% | 0.07% | 26880 | Polk |
| 0.37% | 0.40% | 0.40% | 0.00% | 6523 | Putnam |
| -3.26% | 0.93% | 0.91% | 0.02% | 34011 | Santa Rosa |
| 4.40% | 2.71% | 2.47% | 0.24% | 9360 | Sarasota |
| 4.00% | 2.46% | 2.45% | 0.01% | 13996 | Seminole |
| -1.39% | 1.40% | 1.26% | 0.13% | 31952 | St. Johns |
| 7.18% | 1.41% | 1.44% | -0.03% | -5928 | St. Lucie |
| 1.21% | 0.78% | 0.58% | 0.20% | 13803 | Sumter |
| -13.75% | 0.25% | 0.21% | 0.04% | 5189 | Suwannee |
| -17.01% | 0.12% | 0.11% | 0.01% | 2058 | Taylor |
| -46.53% | 0.07% | 0.06% | 0.00% | 169 | Union |
| 7.74% | 2.94% | 2.91% | 0.03% | 5093 | Volusia |
| -21.92% | 0.21% | 0.17% | 0.03% | 415 | Wakulla |
| -5.00% | 0.35% | 0.32% | 0.03% | 11029 | Walton |
| -16.60% | 0.15% | 0.13% | 0.02% | 3462 | Washington |
| 3.97% | 100.00% | 100.00% | 0.00% | 15226 | Total |


I am still in shock that Rick Scott got elected in a swing state. Texas is suppose to elect the right wing whackos not Florida!
Great entry! This is one of those thorough analysis of races that puts SwingStateProject over other sites for election analysis.
Probably not the debate flap either. Just the nature of the year and Republicans walking over broken glass to vote and Democrats much less so.
over Alex Sink. How any reasonable person could vote for someone whom defrauded Medicare and the government is beyond me. If they let that STUPID text scandal solidify their stupid minds then so be it. It doesn’t give me the best hope for the future of this country and I had that hope after the 2008 elections. I think this diary opened wounds that were healing.
Are massive! Awesome
2008’s total of 32% of the electorate in the Democratic base counties is probably the high-mark for turnout in those counties due to an incredibly energized Democratic base (especially among AA voters) and a very strong GOTV drive by the Obama campaign. OTOH, 2010 probably represents the low-point for turnout, in a midterm year with poor Democratic turnout and high Republican turnout nationwide and possibly an especially unmotivated Democratic electorate in Florida due to the split in the senate race.
Is there a possibility you could do some more maps like this, but for Nevada to compare turnout from the past few presidential elections as well as the 2010 Senate race?