After only two years of a slim 32-30 Democratic majority in the New York State Senate, Republicans in this past election barely took back the chamber that they had previously held continuously for more than forty years. People around the country endlessly ask the question: how is it possible that Republicans have a majority of state senators in a state as “blue” as New York?
There is no simple answer to that question. Sufficed it to say, one of the most important factors is gerrymandering. Republicans did a masterful job of redistricting a very favorable map for themselves ten years ago. The current map is littered with Republican senators holding light blue Obama districts all over Long Island (9-0 Republican) and Upstate (21-4). With the great help of Daves Redistricting App 2.0, I set about in the task of redistricting New York's State Senate districts with three main goals in mind: 1.) connect Democratic towns and cities in Long Island, 2.) preserve majority-minority districts in New York City, and 3.) consolidate small cities Upstate. Much of the basis for my analysis comes from jeffmd's excellent post on the State Senate written in 2009 in which he looked at the numbers for the current districts. Inspecting the presidential toplines, it was determined that the cutoff between Republican and Democratic districts is about 58-60% Obama. My map uses that percentage as the benchmark. It would create 10 Democratic districts at over 58% in Upstate New York and another four at over 62% in Long Island. Combined with New York City, this would be more than enough to give Democrats a two-to-one majority in the State Senate. So without further ado, here is what I came up with:

| District | Pop. Center | Pop. | Wh% | Bl% | Asn% | Hisp% | Oth% | O% | M% | ||
| D | 1 | Hamptons | 318633 | 66 | 11 | 3 | 17 | 2 | 62 | 38 | |
| R | 2 | Brookhaven | 318569 | 89 | 2 | 2 | 6 | 1 | 49 | 51 | |
| R | 3 | Lindenhurst | 318229 | 89 | 2 | 1 | 6 | 1 | 47 | 53 | |
| D | 4 | Huntington | 318189 | 60 | 17 | 3 | 18 | 2 | 63 | 36 | |
| R | 5 | Smithtown | 318668 | 91 | 1 | 3 | 4 | 1 | 46 | 54 | |
| R | 6 | Massapequa | 318525 | 90 | 0 | 3 | 5 | 1 | 44 | 56 | |
| D | 7 | Great Neck | 318243 | 67 | 12 | 8 | 11 | 2 | 64 | 35 | |
| D | 8 | Hempstead | 318681 | 51 | 26 | 3 | 18 | 2 | 69 | 31 | |
| R | 9 | Garden City | 318620 | 86 | 1 | 5 | 7 | 1 | 43 | 56 | |
| D | 10 | Jamaica | 317030 | 9 | 55 | 9 | 15 | 12 | Black Majority | 92 | 8 |
| D | 11 | Bayside | 317619 | 60 | 5 | 18 | 13 | 3 | 62 | 37 | |
| D | 12 | Astoria | 315924 | 42 | 5 | 13 | 34 | 5 | 78 | 21 | |
| D | 13 | East Elmhurst | 318053 | 15 | 9 | 16 | 57 | 3 | Hispanic Majority | 81 | 18 |
| D | 14 | St. Albans | 318613 | 22 | 55 | 4 | 13 | 5 | Black Majority | 82 | 17 |
| D | 15 | Forest Hills | 316488 | 59 | 5 | 15 | 17 | 5 | 63 | 36 | |
| D | 16 | Flushing | 317432 | 24 | 3 | 48 | 21 | 4 | Asian Plurality | 68 | 31 |
| D | 17 | Bushwick | 317715 | 13 | 13 | 7 | 60 | 6 | Hispanic Majority | 87 | 12 |
| D | 18 | Bedford-Stuyvesant | 317273 | 26 | 51 | 2 | 17 | 4 | Black Majority | 90 | 9 |
| D | 19 | Canarsie | 317538 | 28 | 52 | 3 | 14 | 3 | Black Majority | 83 | 17 |
| D | 20 | Brooklyn Heights | 318797 | 25 | 51 | 3 | 18 | 3 | Black Majority | 93 | 6 |
| D | 21 | Prospect | 318898 | 19 | 51 | 5 | 22 | 3 | Black Majority | 92 | 7 |
| D | 22 | East Flatbush | 317890 | 21 | 56 | 6 | 12 | 5 | Black Majority | 85 | 14 |
| R | 23 | Homecrest | 316816 | 81 | 1 | 11 | 6 | 2 | 33 | 67 | |
| D | 24 | Brighton Beach | 317711 | 56 | 6 | 21 | 13 | 3 | 55 | 44 | |
| D | 25 | North Shore | 318201 | 49 | 13 | 10 | 24 | 4 | 66 | 34 | |
| R | 26 | Arden Heights | 323582 | 84 | 1 | 6 | 7 | 1 | 37 | 62 | |
| D | 27 | East Village | 311559 | 45 | 6 | 27 | 19 | 3 | 84 | 15 | |
| D | 28 | Upper East Side | 309905 | 83 | 3 | 8 | 5 | 2 | 75 | 24 | |
| D | 29 | Upper West Side | 310495 | 73 | 5 | 8 | 11 | 2 | 85 | 14 | |
| D | 30 | Spanish Harlem | 309111 | 22 | 23 | 3 | 50 | 2 | Hispanic Majority | 91 | 8 |
| D | 31 | Bedford Park | 308720 | 12 | 19 | 5 | 61 | 3 | Hispanic Majority | 90 | 9 |
| D | 32 | Harlem | 309836 | 2 | 61 | 1 | 33 | 2 | Black Majority | 97 | 2 |
| D | 33 | Washington Heights | 309056 | 22 | 12 | 4 | 60 | 2 | Hispanic Majority | 90 | 9 |
| D | 34 | Soundview | 309592 | 10 | 28 | 3 | 55 | 3 | Hispanic Majority | 90 | 10 |
| D | 35 | Belmont | 308704 | 21 | 21 | 3 | 53 | 2 | Hispanic Majority | 84 | 16 |
| D | 36 | Mount Vernon | 309493 | 14 | 60 | 2 | 20 | 4 | Black Majority | 92 | 8 |
| D | 37 | Harrison | 309361 | 73 | 7 | 5 | 13 | 2 | 61 | 38 | |
| D | 38 | Yonkers | 309287 | 56 | 14 | 5 | 21 | 3 | 64 | 35 | |
| D | 39 | Ossining | 309454 | 76 | 7 | 3 | 13 | 1 | 59 | 40 | |
| D | 40 | Clarkstown | 317946 | 72 | 10 | 5 | 10 | 2 | 53 | 47 | |
| R | 41 | Carmel | 321768 | 88 | 3 | 2 | 6 | 1 | 46 | 53 | |
| D | 42 | Poughkeepsie | 317728 | 71 | 12 | 2 | 13 | 2 | 58 | 41 | |
| D | 43 | Kingston | 320216 | 85 | 6 | 1 | 6 | 2 | 60 | 38 | |
| D | 44 | Troy | 317388 | 86 | 6 | 3 | 3 | 2 | 58 | 40 | |
| D | 45 | Plattsburgh | 317612 | 94 | 2 | 1 | 2 | 2 | 58 | 40 | |
| D | 46 | Albany | 315314 | 84 | 9 | 2 | 3 | 1 | 63 | 35 | |
| R | 47 | Moreau | 317511 | 96 | 1 | 1 | 1 | 1 | 49 | 49 | |
| R | 48 | Rome | 317470 | 91 | 4 | 1 | 3 | 1 | 44 | 54 | |
| D | 49 | Syracuse | 317634 | 80 | 12 | 2 | 3 | 3 | 62 | 36 | |
| R | 50 | Utica | 317412 | 91 | 4 | 1 | 2 | 1 | 54 | 45 | |
| R | 51 | Herkimer | 316544 | 96 | 1 | 0 | 2 | 1 | 45 | 53 | |
| R | 52 | Blooming Grove | 319845 | 90 | 3 | 1 | 4 | 1 | 46 | 52 | |
| D | 53 | Ithaca | 318178 | 87 | 4 | 3 | 3 | 2 | 61 | 38 | |
| R | 54 | Penn Yan | 317011 | 95 | 2 | 0 | 2 | 2 | 47 | 51 | |
| R | 55 | Perinton | 316789 | 92 | 3 | 3 | 2 | 1 | 51 | 47 | |
| D | 56 | Rochester | 318289 | 60 | 26 | 3 | 9 | 2 | 72 | 27 | |
| R | 57 | Corning | 317311 | 95 | 1 | 1 | 1 | 2 | 42 | 56 | |
| D | 58 | Amherst | 317906 | 80 | 14 | 2 | 2 | 1 | 61 | 38 | |
| R | 59 | Hamburg | 318084 | 94 | 1 | 1 | 2 | 2 | 49 | 49 | |
| D | 60 | Buffalo | 317816 | 67 | 23 | 1 | 6 | 3 | 69 | 29 | |
| R | 61 | Batavia | 318545 | 94 | 2 | 0 | 2 | 1 | 41 | 57 | |
| R | 62 | Greece | 318537 | 93 | 3 | 1 | 2 | 1 | 46 | 52 |
Note, also, that I broke the state into four regions for simplicity: Upstate, Westchester/Bronx/Manhattan, Brooklyn/Queens/Staten Island, and Long Island. Here is another table that breaks down the numbers by region:
| Region | County | Population | Districts | (+/-) | 316280 | (+/-) |
| Long Island | Suffolk | 1516544 | ||||
| Nassau | 1349555 | |||||
| 2866099 | 9 | 0 | 318323 | 0.6 | ||
| New York City | Queens | 2320449 | ||||
| Brooklyn | 2588844 | |||||
| Staten Island | 496246 | |||||
| 5405539 | 17 | 1 | 317972 | 0.5 | ||
| Manhattan | 1646675 | |||||
| Bronx | 1415056 | |||||
| Westchester | 961565 | |||||
| 4023296 | 13 | 1 | 309484 | -2.1 | ||
| Ustate New York | Rockland | 301308 | ||||
| Other | 7010169 | |||||
| 7311477 | 23 | -2 | 317890 | 0.5 |
As you can see from the table, I redraw the map so that NYC gained two seats at the expense of Upstate New York, while Long Island remained the same at 9 districts. The population of each district in each region is very equal with the greatest deviation of -2.1% below the ideal population in the region of Westchester/Bronx/Manhattan. The rest of the seats compensate for this by being about .5% above the ideal. Before discussing the statewide changes that would occur under this redistricting plan, first let me go through the four regions themselves…
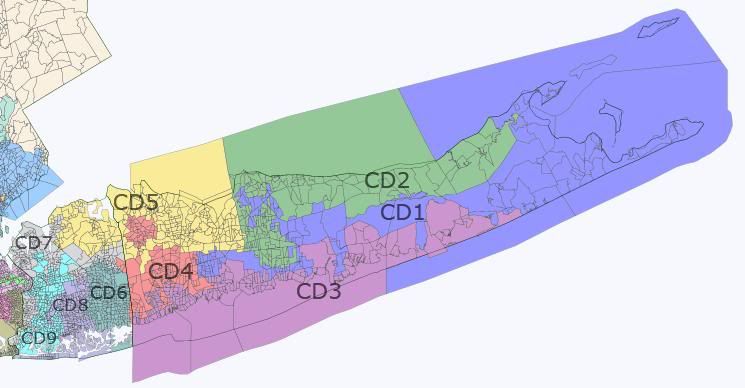
Long Island
| District | Pop. Center | Pop. | Wh% | Bl% | Asn% | Hisp% | Oth% | O% | M% | |||
| D | 1 | Hamptons | 318633 | 66 | 11 | 3 | 17 | 2 | 62 | 38 | ||
| R | 2 | Brookhaven | 318569 | 89 | 2 | 2 | 6 | 1 | 49 | 51 | Ken LaValle-1, Port Jefferson | |
| R | 3 | Lindenhurst | 318229 | 89 | 2 | 1 | 6 | 1 | 47 | 53 | Lee Zeldin-3, Shirley | Owen Johnson-4, West Babylon |
| D | 4 | Huntington | 318189 | 60 | 17 | 3 | 18 | 2 | 63 | 36 | ||
| R | 5 | Smithtown | 318668 | 91 | 1 | 3 | 4 | 1 | 46 | 54 | John Flanagan-2, East Northport | Carl Marcellino-5, Syosset |
| R | 6 | Massapequa | 318525 | 90 | 0 | 3 | 5 | 1 | 44 | 56 | ||
| D | 7 | Great Neck | 318243 | 67 | 12 | 8 | 11 | 2 | 64 | 35 | ||
| D | 8 | Hempstead | 318681 | 51 | 26 | 3 | 18 | 2 | 69 | 31 | Charles Fuschillo-8, Merrick | Dean Skelos-9, Rockville Centre |
| R | 9 | Garden City | 318620 | 86 | 1 | 5 | 7 | 1 | 43 | 56 | Kemp Hannon-6, Garden City | Jack Martins-7, Mineola |
(The table above is a portion derived from the table in the intoduction. However, included in this table and the three that are to follow it, the number for each district has a link to a picture of that district's new boundaries. Also, I included the incumbent senators in whichever district that they would live in if my map went into affect. Each senator's party is denoted by the font color, and the data entries include the number district that each senator currently represents in the State Senate, as well as where they live and a link to their official biographies.)
Long Island has been the province of Republicans in the New York State Senate for many decades. At the height of the Democratic wave in 2008, Long Island elected only two Democratic senators out of nine total. Both of them lost their seats in this last election, returning Long Island to its usual position of having only Republicans represent them in the State Senate. It's not as though Long Island is that conservative overall — indeed, all but one of the current nine senate districts in Nassau and Suffolk Counties was won by Obama. Republicans have been very effective in diluting Democratic votes, thereby allowing many independents who fear a complete Democratically-controlled Albany to elect Republican candidates for the State Senate.
Of the eight Obama-voting Long Island Senate districts, none of them were won by more than about 55%, which is a very managable percentage for incumbent GOP senators, including the new Majority Leader Dean Skelos, who hails from Rockville Centre in Nassau County. In this region, the goal was to be realistic about what could be achieved and very cautious in achieving it. I drew up four Democratic districts each at over 62% for Obama.
Three out of the four new Democratic districts that I created are left open for any Dem who wants them. The most Democratic district in the region — SD-8, based in Hempstead and Long Beach — is occupied by Skelos and Senator Charles Fuschillo. As the Black and Hispanic populations are spread throughout Long Island, each district retains their white majority.
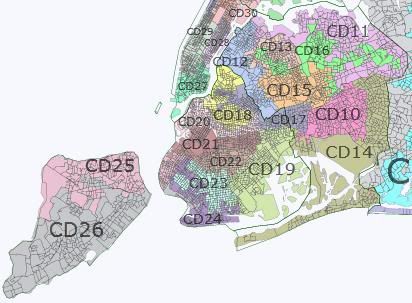
Queens, Brooklyn, and Staten Island
| District | Pop. Center | Pop. | Wh% | Bl% | Asn% | Hisp% | Oth% | O% | M% | |||||
| D | 10 | Jamaica | 317030 | 9 | 55 | 9 | 15 | 12 | Black Majority | 92 | 8 | Shirley Huntley-10, Jamaica | ||
| D | 11 | Bayside | 317619 | 60 | 5 | 18 | 13 | 3 | 62 | 37 | Tony Avella-11, Whitestone | |||
| D | 12 | Astoria | 315924 | 42 | 5 | 13 | 34 | 5 | 78 | 21 | Michael Gianaris-12, Astoria | |||
| D | 13 | East Elmhurst | 318053 | 15 | 9 | 16 | 57 | 3 | Hispanic Majority | 81 | 18 | |||
| D | 14 | St. Albans | 318613 | 22 | 55 | 4 | 13 | 5 | Black Majority | 82 | 17 | Malcolm Smith-14, St. Albans | ||
| D | 15 | Forest Hills | 316488 | 59 | 5 | 15 | 17 | 5 | 63 | 36 | ||||
| D | 16 | Flushing | 317432 | 24 | 3 | 48 | 21 | 4 | Asian Plurality | 68 | 31 | Toby Ann Stavisky-16, Flushing | ||
| D | 17 | Bushwick | 317715 | 13 | 13 | 7 | 60 | 6 | Hispanic Majority | 87 | 12 | Joseph Addabbo-15, Ozone Park | Martin Malave Dilan-17, Bushwick | |
| D | 18 | Bedford-Stuyvesant | 317273 | 26 | 51 | 2 | 17 | 4 | Black Majority | 90 | 9 | |||
| D | 19 | Canarsie | 317538 | 28 | 52 | 3 | 14 | 3 | Black Majority | 83 | 17 | John Sampson-19, Canarsie | ||
| D | 20 | Brooklyn Heights | 318797 | 25 | 51 | 3 | 18 | 3 | Black Majority | 93 | 6 | Valmanette Montgomery-18, Boerum Hills | Eric Adams-20, Crown Heights | Daniel Squadron-25, Brooklyn Heights |
| D | 21 | Prospect | 318898 | 19 | 51 | 5 | 22 | 3 | Black Majority | 92 | 7 | Kevin Parker-21, Flatbush | ||
| D | 22 | East Flatbush | 317890 | 21 | 56 | 6 | 12 | 5 | Black Majority | 85 | 14 | |||
| R | 23 | Homecrest | 316816 | 81 | 1 | 11 | 6 | 2 | 33 | 67 | Martin Golden-22, Bay Ridge | |||
| D | 24 | Brighton Beach | 317711 | 56 | 6 | 21 | 13 | 3 | 55 | 44 | Carl Kruger-27, Sheepshead Bay | |||
| D | 25 | North Shore | 318201 | 49 | 13 | 10 | 24 | 4 | 66 | 34 | Diane Savino-23, Staten Island | |||
| R | 26 | Arden Heights | 323582 | 84 | 1 | 6 | 7 | 1 | 37 | 62 | Andrew Lanza-24, Great Kills |
While much of Staten Island remains a stubborn Republican bulwark, Queens and Brooklyn voted overwhelmingly for Barack Obama in 2008. They are home to most of New York City's black population, as well as significant Hispanic and Asian communities. Since this area of the state is so heavily Democratic, the overriding goal for this region was not to squeeze out more Democratic seats, but to strengthen a few shaky ones and create new Voting Rights Act (VRA) districts wherever possible. Under my plan, this region would gain one additional seat as a result of new population estimates given by the Census Bureau.
This map preserves the two African-American majority districts in Queens and adds a fifth black majority district to the four that already exist in Brooklyn. One of the best things about this map is that it creates an Asian plurality district that is based in Flushing and spread throughout many parts of Queens. The 16th district is currently represented by Sen. Toby Ann Stavisky, but if the Asian community were able to unite around a consensus candidate, she could well be displaced in a primary. I found it impossible to make the 16th District any more heavily Asian than 48%, but the next largest racial community was 24% of the population, so if Stavisky were to retire, this would most likely go to an Asian candidate. It also preserves the two Hispanic majority districts in Queens and Brooklyn.
The recently-flipped 11th and 15th Districts would be strengthened for the Democrats. Carl Kruger's 27th district in southern Brooklyn would be radically changed into the 24th district, both strengthening our vote there and also allowing for a primary challenge to the less-than-venerable “Amigo.” At 55% for Obama, the 24th is one of two districts that I created below the magic 58% line that I still counted in the Democratic column — largely because presidential voting patterns in southern Brooklyn are volatile and not necessarily indicative of a broader ideological differentiation. What Republican-leaning communities that do exist here would be consolidated into two large McCain majority districts: the 23rd in southern Brooklyn and the 26th in southern Staten Island, both of which are currently represented by Republican Senators anyway.
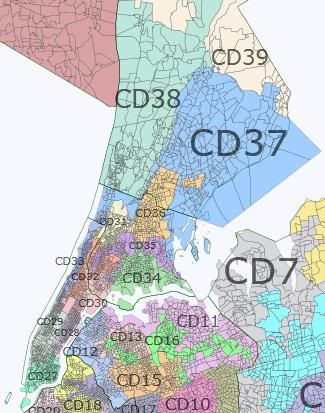
Manhattan, Bronx, and Westchester County
| District | Pop. Center | Pop. | Wh% | Bl% | Asn% | Hisp% | Oth% | O% | M% | ||||
| D | 27 | East Village | 311559 | 45 | 6 | 27 | 19 | 3 | 84 | 15 | |||
| D | 28 | Upper East Side | 309905 | 83 | 3 | 8 | 5 | 2 | 75 | 24 | Liz Krueger-26, Upper East Side | ||
| D | 29 | Upper West Side | 310495 | 73 | 5 | 8 | 11 | 2 | 85 | 14 | Thomas Duane-29, Upper West Side | ||
| D | 30 | Spanish Harlem | 309111 | 22 | 23 | 3 | 50 | 2 | Hispanic Majority | 91 | 8 | Jose Serrano-28, Spanish Harlem | |
| D | 31 | Bedford Park | 308720 | 12 | 19 | 5 | 61 | 3 | Hispanic Majority | 90 | 9 | Gustavo Rivera-33, Kingsbridge Heights | |
| D | 32 | Harlem | 309836 | 2 | 61 | 1 | 33 | 2 | Black Majority | 97 | 2 | Bill Perkins-30, Harlem | |
| D | 33 | Washington Heights | 309056 | 22 | 12 | 4 | 60 | 2 | Hispanic Majority | 90 | 9 | Adriano Espaillat-31, Washington Heights | |
| D | 34 | Soundview | 309592 | 10 | 28 | 3 | 55 | 3 | Hispanic Majority | 90 | 10 | Ruben Diaz-32, Soundview | Jeffrey Klein-34, Throgs Neck |
| D | 35 | Belmont | 308704 | 21 | 21 | 3 | 53 | 2 | Hispanic Majority | 84 | 16 | ||
| D | 36 | Mount Vernon | 309493 | 14 | 60 | 2 | 20 | 4 | Black Majority | 92 | 8 | Ruth Hassel-Thompson-36, Williamsbridge | |
| D | 37 | Scarsdale | 309361 | 73 | 7 | 5 | 13 | 2 | 61 | 38 | Suzi Oppenheimer-37, Mamaroneck | ||
| D | 38 | Yonkers | 309287 | 56 | 14 | 5 | 21 | 3 | 64 | 35 | Andrea Stewart-Cousins-35, Yonkers | ||
| D | 39 | Ossining | 309454 | 76 | 7 | 3 | 13 | 1 | 59 | 40 |
This region, encompassing Manhattan, Bronx, and Westchester County, is the most strongly Democratic area in one of the most Democratic-leaning states in the Union. It is home to the largest Hispanic communities in the Northeast United States — mostly Peurto Rican, but also Dominican, Mexican, and other Latin American heritages. The white communities here also tend to be much more liberal than their counterparts in Brooklyn, Queens, and Staten Island. That is especially the case in Manhattan and Westchester, which are home to many educated urban white professionals.
All twelve districts here are represented by Democrats in the State Senate. That would stay the same under my plan, except for the addition of a thirteenth Democratic district. This is the second distric that comes at the expense of Upstate New York — the other one being in Brooklyn.
Both majority African-American districts would remain intact. The map also adds another Hispanic-majority district to the four that currently exist.
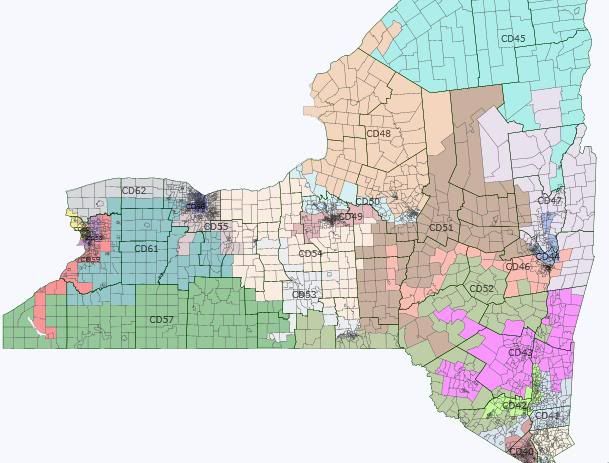
Upstate New York
| District | Pop. Center | Pop. | Wh% | Bl% | Asn% | Hisp% | Oth% | O% | M% | |||
| D | 40 | Clarkstown | 317946 | 72 | 10 | 5 | 10 | 2 | 53 | 47 | David Carlucci-38, Clarkstown | |
| R | 41 | Carmel | 321768 | 88 | 3 | 2 | 6 | 1 | 46 | 53 | Greg Ball-40, Patterson |
|
| D | 42 | Poughkeepsie | 317728 | 71 | 12 | 2 | 13 | 2 | 58 | 41 | Bill Larkin-39, New Windsor | Stephen Saland-41, Poughkeepsie |
| D | 43 | Kingston | 320216 | 85 | 6 | 1 | 6 | 2 | 60 | 38 | ||
| D | 44 | Troy | 317388 | 86 | 6 | 3 | 3 | 2 | 58 | 40 | Hugh Farley-44, Schenectady | |
| D | 45 | Plattsburgh | 317612 | 94 | 2 | 1 | 2 | 2 | 58 | 40 | Betty Little-45, Queensbury | Patty Ritchie-48, Heuvelton |
| D | 46 | Albany | 315314 | 84 | 9 | 2 | 3 | 1 | 63 | 35 | Neil Breslin-46, Albany | James Seward-51, Milford |
| R | 47 | Moreau | 317511 | 96 | 1 | 1 | 1 | 1 | 49 | 49 | Roy McDonald-43, Stillwater | |
| R | 48 | Rome | 317470 | 91 | 4 | 1 | 3 | 1 | 44 | 54 | Joseph Griffo-47, Rome | |
| D | 49 | Syracuse | 317634 | 80 | 12 | 2 | 3 | 3 | 62 | 36 | David Valesky-49, Oneida | John DeFrancisco-50, Syracuse |
| R | 50 | Utica | 317412 | 91 | 4 | 1 | 2 | 1 | 54 | 45 | ||
| R | 51 | Herkimer | 316544 | 96 | 1 | 0 | 2 | 1 | 45 | 53 | ||
| R | 52 | Blooming Grove | 319845 | 90 | 3 | 1 | 4 | 1 | 46 | 52 | John Bonacic-42, Mount Hope | |
| D | 53 | Ithaca | 318178 | 87 | 4 | 3 | 3 | 2 | 61 | 38 | Thomas Libous-52, Binghamton | Michael Nozzollio-54, Fayette |
| R | 54 | Sodus | 317011 | 95 | 2 | 0 | 2 | 2 | 47 | 51 | ||
| R | 55 | Perinton | 316789 | 92 | 3 | 3 | 2 | 1 | 51 | 47 | James Alesi-55, East Rochester | |
| D | 56 | Rochester | 318289 | 60 | 26 | 3 | 9 | 2 | 72 | 27 | ||
| R | 57 | Corning | 317311 | 95 | 1 | 1 | 1 | 2 | 42 | 56 | Thomas O'Mara-53, Big Flats | Catharine Young-57, Olean |
| D | 58 | Amherst | 317906 | 80 | 14 | 2 | 2 | 1 | 61 | 38 | Tim Kennedy-58, Buffalo | |
| R | 59 | Hamburg | 318084 | 94 | 1 | 1 | 2 | 2 | 49 | 49 | Pat Gallivan-59, Elma | Mike Ranzenhofer-61, Clarence |
| D | 60 | Buffalo | 317816 | 67 | 23 | 1 | 6 | 3 | 69 | 29 | Mark Grisanti-60, Buffalo | |
| R | 61 | Batavia | 318545 | 94 | 2 | 0 | 2 | 1 | 41 | 57 | ||
| R | 62 | Greece | 318537 | 93 | 3 | 1 | 2 | 1 | 46 | 52 | Joe Robach-56, Greece | George Maziarz-62, Newfane |
Here more than anywhere else in the state, Republicans dominate in local and state politics. Recently, Democrats lost five of their ten Upstate congressional districts. This is also where Republicans picked up two Senate seats and gained about a half-dozen Assembly seats last fall. Nevertheless, there are still many strongly Democratic areas of Upstate New York: mostly medium- and small-sized cities and liberal inner-suburbs that dot the landscape from the Hudson Valley to the Great Lakes. The goal was to consolidate those areas and churn out as many new Democratic districts as possible. Here again, as in Long Island, the minority ethnic populations are too spread out to create any VRA districts. Instead, this is where the great bulk of Republican Senate seats would hit the buzz-saw.
The region as a whole would lose two seats, mostly from the equalization of populations in each Senate district — which Republicans largely disregarded during the last redistricting ten years ago — as well as the much greater population growth downstate.
I was able to get about half of these 23 districts in the Democratic column. The 40th District, based in Rockland County, is the second of only two districts in this entire map (the other being in southern Brooklyn) that I counted as a Democratic district even though Obama's vote there was less than 58%. The reason is that this seat was one of very few elected offices around the country that Democrats actually gained from the Republicans in this last election. The seat would also bolster its Democratic vote through redistricting, so I figured, if David Carlucci could pick it up for the Dems in a year like 2010, odds are pretty good that he'll be able to hold it in a lot of other political environments.
I was able to get ten of these districts at over 58% for Obama. One of the most certain Democratic gains under this plan would be my native 56th Senate District, based in the City of Rochester and the Town of Brighton. Republican Senator Joe Robach has vexingly been able to hold onto this district for years despite the fact that it voted by a two-to-one margin for Barack Obama in 2008 (66%-33%). Under this plan, Robach's hometown of Greece would be removed from the 56th and replaced by the Democratic-leaning suburbs of Gates and Irondequoit.
The four seats that we do hold here would be strengthened. The 60th District, which is even more Democratic district than the 56th, voted out a Democratic incumbent last fall. This district would remain largely unchanged in the hope that a different Dem might likely be able to win it back from freshman Republican Senator Mark Grisanti.
As is convention when State Senate seats are redistricted in Upstate New York, I left every town intact. In addition, only two cities are divided between different districts: Buffalo and Tonawanda (just south of Niagra Falls). The self-imposed requirement that towns be left undivided was a major constraint, but it would probably help a plan like this to survive a court challenge.
Summary:
A major drawback of this map is that without realizing it, I redraw the lines with no attention paid to which district each senator lives in. Hence, a lot of Democratic primaries and games of musical chairs would happen in this plan that might otherwise have been avoided. But, by the time I realized it, it was too late. In any event, many more Republicans get stuck together than Democrats, so that serves to counter-balance this problem.
This map pays tribute to the Voting Rights Act by creating three new majority-minority district: a new Black-majority district in Brooklyn, an Asian-plurality district in Queens, and a fifth Hispanic-majority district in the Bronx.
My plan also evens out the population disparities between regions by making every seat within only a few thousands residents off from the ideal population of 316,280 people per district. In applying a fairer division among the state's population and using new population estimates given by the Census, Upstate New York lost two districts to New York City.
I am confident that if this plan went into affect at the next election, Democrats would hold a large 43-19 majority in the New York State Senate for many years to come. But alas, Republicans won back this chamber last year and thus, it is not to be. However, I'm still convinced that with new population estimates, it will be extremely difficult for Republicans to redistrict another map that would allow them to retain the majority. Their luck has simply run out. They may be able to preserve many incumbents in Upstate and Long Island, but remember that Democrats only need to gain one seat for them to retake the majority (a 31-31 tie would allow Democratic Lt. Gov. Bob Duffy to act as the tie-breaker). And as I've shown through this analysis, downstate will have to gain two seats for the next redistricting plan to be in compliance with the Census.
It took many practice tries, but I believe this map provides the strongest possible plan for a large Democratic majority in the Senate that not only respects existing VRA districts, but also creates three new ones. In short, this is the ideal Democratic redistricting plan for the New York State Senate.
must be able to read the writing on the wall. Heck, one of their own in the State Senate is a registered Democrat who represents a Dem district. There’s not much they can do to stop the inevitable.
I think the best the Democrats can hope for, with their political power levels in state government, is to have a nonpartisan federal redistricting. With nonpartisan redistricting, I think two upstate Republicans would get the knife, but bipartisan redistricting means a Democratic seat will be sacrificed somewhere (I keep hearing it will be downstate, but I’m not sure how you would do that without making another upstate district into a downstate one).
As for the state senate, the most we can hope for is the Democrats lean on the Republicans not to use the statutorily allowed 10% population variance this time. I’m surprised it’s not unconstitutional frankly.
(I think nonpartisan redistricting would eliminate two Republicans upstate, while bipartisan means some Democrat somewhere will get the knife )
that Republicans cannot retain their majority even if they get to draw their own map again.
However, Republicans can squeeze out another GOP seat in South Brooklyn, Kruger’s seat will flip to Republicans once he retires, and probably a seat in Queens, now that they don’t have to gerrymander 2 seats there.
In South Brooklyn, my neighborhood, Borough Park is split between 3 districts to prevent it from voting in a GOP leaning senate district, I don’t know why.
but make sure that you don’t cut township boundaries. That is illegal under the NYS Constitution. Cities can be chopped up but townships cannot. Eyeballing your Westchester map, it seems that you have violated this principle, but I could be wrong.
I’ll be interested to see what happens with Diane Savino’s Staten Island seat. The Republicans went after the seat last round and fell flat on their face. Diane has done a good job of balancing out the interests of the more liberal minority Staten Island north shore and the more conservative white ethnic Brooklyn areas she has.
I wouldnt be shocked if her house somehow ended in Lanza’s district. The Democratic leader certaily doesnt want someone who helped form a caucus for the expressed purpose of unseating him. And the Republican leader who probably will end up controlling the State Senate redistricting would of course love an open seat to see if they have better luck with an open seat.
Course you don’t want to weaken Lanza’s district too much since both Molinari and the tea party are looking to purge him which may create an open seat. And open seats are always prone to surprises.
douche-bag move of suing a homeowner/builder because he fell from a ladder the builder had in the back of the house.
Alesi was trespassing at the time and waited 3 years to the day when the statue of limitation ran out on the potential trespassing charge to sue
Douche-bag. He needs to be voted out of office. It’s a pretty swing district as well.
http://www.13wham.com/news/loc…
Douche-bag did just withdraw the suit within the past hour or so.
lines–if you have two years maybe you could do the state house. Sure its only a 150 seats?
Plus how NH house??
Just kidding a bit!!!
either way great work.
First, the fact that the Republicans won the senate while losing the 11th (Padavan), 15th (Maltese), 26th (Goodman) , 34th (Velella), 35th (Spano) and 38th (Morahan) in the last 5 elections demonstrates how effective the gerrymandering can be aided by fed-up Democrats that threw out Thompson (60th) and nearly Oppenheimer 37th.
The biggest issue the Republicans have is the population shift as upstate has lost 50,000 residents while the downstate region added 500,000 residents. There will be a shift of nearly two seats downstate.
In 2002, the Republicans created the new 62nd district to avoid eliminating an upstate district. They may need to add a 63rd district this time around.
Possible Gerrymandering:
They can combine the strongest republican populations of the 11th (Padavan) and East Bronx part of the 34th (Klein).
Move around democratic and republican towns in Westchester to create a mostly white republican favored district ( East Yonkers, Eastchester, Harrison, Mamoronek, Town and City of Rye and give Andrea Stewart Cousins the Democratic Towns of Ossining, New Castle and Mount Kisco and city of White Plains.
Westchester should be fun.
60th Mark Grisanti will lose the black parts of Buffalo ( 30% of the district) and trade it with a heavily white town in Erie County now represented by Tim Kennedy whose Erie county district is 91% white.
49th Valesky will have a new towns added to give the Republicans a chance of unseating him.
Overall, the Republicans will have a tough time due to the massive shift in population this time around and they have a new set of marginal seats.
They will blow it if the districts with large black populations upstate are under populated giving blacks a larger % of the vote (Grisanti, Robach, Valesky,) plus Martins and Hannon in Nassau) For these districts, they may need to overpopulate, not underpopulate since Obama will be running strong again in 2012.