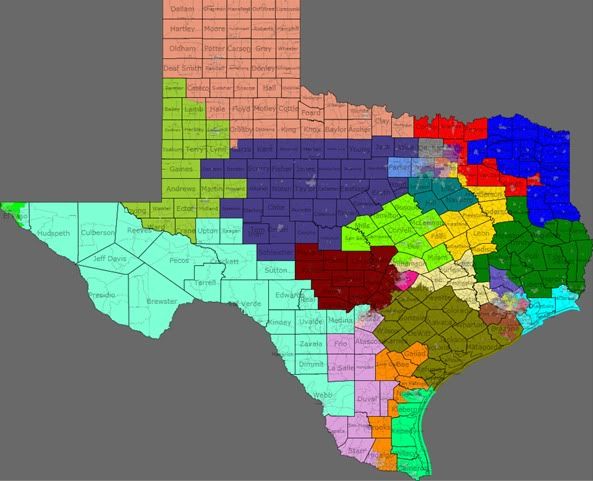
This diary takes a look at what might have happened if the 2003 Texas redistricting had never occurred. I compared the 2000 demographics and presidential results for the map used in the 2002 elections with the 2008 demographics and presidential results under the same lines. I used Dave’s App to do this, with the Test Data setting to get the political data, but the regular voting district map (without the Test Data setting) to get the correct demographic estimates. I also looked at the shifts for the districts during this time period and elaborated a bit on what might have occurred had this map remained in place for the rest of the decade. Please vote in the survey at the end as well. Thanks and enjoy!
Statewide Map
East Texas
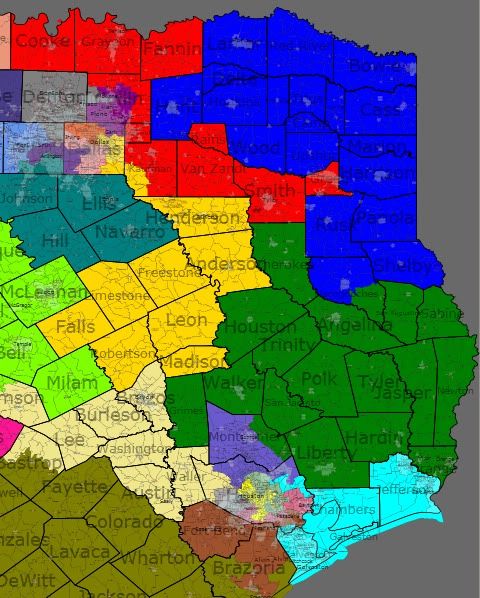
District 1 (Blue); Northeast Texas-Texarkana, Paris, Greenville, Nacogdoches, Marshall
2002 winner and winning percentage: Max Sandlin (D), 56%
|
% white |
% black |
% Hispanic |
% Asian |
Total district population |
| 2000 population |
75 |
16 |
7 |
0 |
651,619 |
| 2008 population (est.) |
72 |
15 |
11 |
1 |
683,417 |
| Change from 2000 to 2008 |
-3 |
-1 |
+4 |
+1 |
+31,798 |
| 2000 presidential results |
2008 presidential results |
Partisan swing from 2000 to 2008 |
| 64% Bush-36% Gore |
69% McCain-30% Obama |
+5% Republican, -6% Democratic |
District 2 (Green): East Texas-Lufkin, Orange, Huntsville, Liberty
2002 winner and winning percentage: Jim Turner (D), 61%
|
% white |
% black |
% Hispanic |
% Asian |
Total district population |
| 2000 population |
76 |
14 |
9 |
0 |
651,619 |
| 2008 population (est.) |
73 |
13 |
12 |
1 |
683,417 |
| Change from 2000 to 2008 |
-3 |
-1 |
+3 |
+1 |
+37,712 |
| 2000 presidential results |
2008 presidential results |
Partisan swing from 2000 to 2008 |
| 63% Bush-37% Gore |
70% McCain-29% Obama |
+7% Republican, -8% Democratic |
District 4 (Red): North and East Texas-Longview, Tyler, Sherman
2002 winner and winning percentage: Ralph Hall (D), 58%
|
% white |
% black |
% Hispanic |
% Asian |
Total district population |
| 2000 population |
77 |
12 |
9 |
1 |
651,620 |
| 2008 population (est.) |
72 |
11 |
14 |
1 |
773,426 |
| Change from 2000 to 2008 |
-5 |
-1 |
+5 |
0 |
+121,806 |
| 2000 presidential results |
2008 presidential results |
Partisan swing from 2000 to 2008 |
| 70% Bush-30% Gore |
70% McCain-29% Obama |
0% Republican, -1% Democratic |
District 9 (Light Blue): East Texas and Harris County-Beaumont, Port Arthur, Galveston, Texas City
2002 winner and winning percentage: Nick Lampson (D), 59%
|
% white |
% black |
% Hispanic |
% Asian |
Total district population |
| 2000 population |
60 |
21 |
14 |
3 |
651,619 |
| 2008 population (est.) |
56 |
21 |
19 |
3 |
675,944 |
| Change from 2000 to 2008 |
-4 |
0 |
+5 |
0 |
+24,325 |
| 2000 presidential results |
2008 presidential results |
Partisan swing from 2000 to 2008 |
| 55% Bush-45% Gore |
56% McCain-43% Obama |
+1% Republican, -2% Democratic |
Dallas/Fort Worth Area
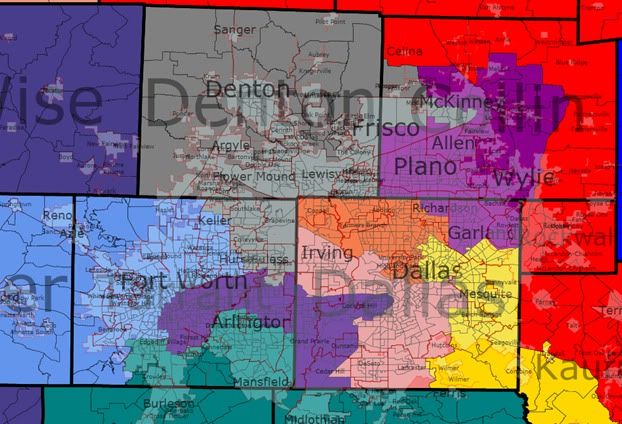
District 3 (Purple):Collin County and northern Dallas County-Richardson, Garland, Plano, McKinney
2002 winner and winning percentage: Sam Johnson (R), 74%
|
% white |
% black |
% Hispanic |
% Asian |
Total district population |
| 2000 population |
70 |
7 |
14 |
7 |
651,620 |
| 2008 population (est.) |
61 |
9 |
18 |
10 |
898,778 |
| Change from 2000 to 2008 |
-9 |
+2 |
+4 |
+3 |
+247,158 |
| 2000 presidential results |
2008 presidential results |
Partisan swing from 2000 to 2008 |
| 72% Bush-28% Gore |
60% McCain-39% Obama |
-12% Republican, +11% Democratic |
District 5 (Yellow): Dallas County and Central/East Texas-Dallas, Mesquite, Palestine, Athens
2002 winner and winning percentage: Jeb Hensarling (R), 58%
|
% white |
% black |
% Hispanic |
% Asian |
Total district population |
| 2000 population |
63 |
16 |
18 |
2 |
651,620 |
| 2008 population (est.) |
56 |
17 |
23 |
2 |
677,043 |
| Change from 2000 to 2008 |
-7 |
+1 |
+5 |
0 |
+25,423 |
| 2000 presidential results |
2008 presidential results |
Partisan swing from 2000 to 2008 |
| 62% Bush-38% Gore |
57% McCain-42% Obama |
-5% Republican, +4% Democratic |
District 6 (Dark Teal): Tarrant County and Dallas/Fort Worth suburbs and exurbs: Arlington, Ennis, Cleburne, Corsicana
2002 winner and winning percentage: Joe Barton (R), 70%
|
% white |
% black |
% Hispanic |
% Asian |
Total district population |
| 2000 population |
72 |
10 |
14 |
3 |
651,620 |
| 2008 population (est.) |
67 |
11 |
18 |
3 |
748,734 |
| Change from 2000 to 2008 |
-5 |
+1 |
+4 |
0 |
+97,114 |
| 2000 presidential results |
2008 presidential results |
Partisan swing from 2000 to 2008 |
| 67% Bush-33% Gore |
61% McCain-38% Obama |
-6% Republican, +5% Democratic |
District 12 (Periwinkle): Tarrant and Parker Counties-Weatherford, Fort Worth, Keller
2002 winner and winning percentage: Kay Granger (R), 92%
|
% white |
% black |
% Hispanic |
% Asian |
Total district population |
| 2000 population |
71 |
5 |
20 |
2 |
651,619 |
| 2008 population (est.) |
64 |
5 |
26 |
3 |
788,643 |
| Change from 2000 to 2008 |
-7 |
0 |
+6 |
+1 |
+137,024 |
| 2000 presidential results |
2008 presidential results |
Partisan swing from 2000 to 2008 |
| 67% Bush-33% Gore |
65% McCain-34% Obama |
-2% Republican, +1% Democratic |
District 24 (Dark Purple): Dallas and Tarrant Counties-Fort Worth, Arlington, Dallas, Duncanville
2002 winner and winning percentage: Martin Frost (D), 65%
|
% white |
% black |
% Hispanic |
% Asian |
Total district population |
| 2000 population |
35 |
22 |
38 |
3 |
651,619 |
| 2008 population (est.) |
28 |
22 |
45 |
4 |
836,571 |
| Change from 2000 to 2008 |
-7 |
0 |
+7 |
+1 |
+184,952 |
| 2000 presidential results |
2008 presidential results |
Partisan swing from 2000 to 2008 |
| 46% Bush-54% Gore |
36% McCain-63% Obama |
-10% Republican, +9% Democratic |
District 26 (Dark Gray): Denton, Tarrant, and Collin Counties-Denton, Lewisville, Flower Mound, McKinney
2002 winner and winning percentage: Michael Burgess (R), 75%
|
% white |
% black |
% Hispanic |
% Asian |
Total district population |
| 2000 population |
78 |
5 |
11 |
4 |
651,619 |
| 2008 population (est.) |
70 |
7 |
16 |
6 |
897,454 |
| Change from 2000 to 2008 |
-8 |
+2 |
+5 |
+2 |
+245,835 |
| 2000 presidential results |
2008 presidential results |
Partisan swing from 2000 to 2008 |
| 73% Bush-27% Gore |
63% McCain-36% Obama |
-10% Republican, +9% Democratic |
District 30 (Salmon): Dallas County: Dallas, Irving
2002 winner and winning percentage: Eddie Bernice Johnson (D), 74%
|
% white |
% black |
% Hispanic |
% Asian |
Total district population |
| 2000 population |
25 |
41 |
31 |
2 |
651,620 |
| 2008 population (est.) |
19 |
39 |
39 |
2 |
726,340 |
| Change from 2000 to 2008 |
-6 |
-2 |
+8 |
0 |
+74,720 |
| 2000 presidential results |
2008 presidential results |
Partisan swing from 2000 to 2008 |
| 31% Bush-69% Gore |
21% McCain-78% Obama |
-10% Republican, +9% Democratic |
District 32 (Burnt Orange): Dallas County-Dallas, Farmer’s Branch, University/Highland Park, Irving
2002 winner and winning percentage: Pete Sessions (R), 68%
|
% white |
% black |
% Hispanic |
% Asian |
Total district population |
| 2000 population |
55 |
9 |
27 |
6 |
651,619 |
| 2008 population (est.) |
44 |
9 |
38 |
7 |
703,588 |
| Change from 2000 to 2008 |
-11 |
0 |
+11 |
+1 |
+51,969 |
| 2000 presidential results |
2008 presidential results |
Partisan swing from 2000 to 2008 |
| 65% Bush-35% Gore |
53% McCain-46% Obama |
-12% Republican, +13% Democratic |
Houston Area
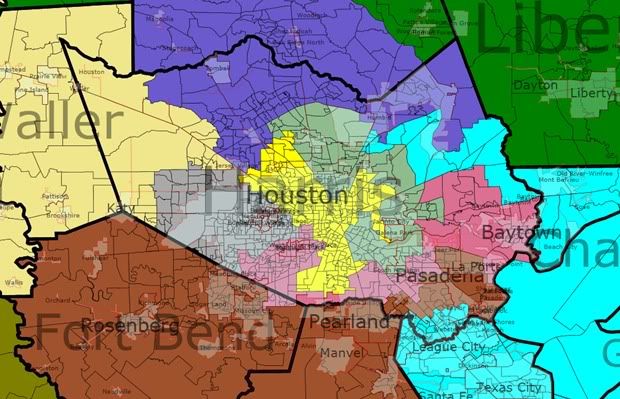
District 7 (Gray): Harris County-western Houston, the Villages
2002 winner and winning percentage: John Culberson (R), 89%
|
% white |
% black |
% Hispanic |
% Asian |
Total district population |
| 2000 population |
50 |
11 |
26 |
11 |
651,620 |
| 2008 population (est.) |
43 |
11 |
32 |
12 |
746,517 |
| Change from 2000 to 2008 |
-7 |
0 |
+6 |
+1 |
+94,897 |
| 2000 presidential results |
2008 presidential results |
Partisan swing from 2000 to 2008 |
| 68% Bush-32% Gore |
55% McCain-44% Obama |
-13% Republican, +12% Democratic |
District 8 (Dark Lavender): Harris and Montgomery Counties-Jersey Village, Humble, Conroe
2002 winner and winning percentage: Kevin Brady (R), 93%
|
% white |
% black |
% Hispanic |
% Asian |
Total district population |
| 2000 population |
77 |
5 |
13 |
3 |
651,619 |
| 2008 population (est.) |
71 |
6 |
18 |
4 |
846,293 |
| Change from 2000 to 2008 |
-6 |
+1 |
+5 |
+1 |
+194,674 |
| 2000 presidential results |
2008 presidential results |
Partisan swing from 2000 to 2008 |
| 78% Bush-22% Gore |
71% McCain-28% Obama |
-7% Republican, +6% Democratic |
District 18 (Banana Yellow): Harris County-Houston
2002 winner and winning percentage: Sheila Jackson-Lee (D), 77%
|
% white |
% black |
% Hispanic |
% Asian |
Total district population |
| 2000 population |
21 |
42 |
33 |
3 |
651,620 |
| 2008 population (est.) |
18 |
41 |
38 |
3 |
779,948 |
| Change from 2000 to 2008 |
-3 |
-1 |
+5 |
0 |
+128,328 |
| 2000 presidential results |
2008 presidential results |
Partisan swing from 2000 to 2008 |
| 26% Bush-74% Gore |
22% McCain-77% Obama |
-4% Republican, +3% Democratic |
District 22 (Brown): Fort Bend, Brazoria, and Harris Counties-Rosenberg, Sugarland, Pearland, Pasadena
2002 winner and winning percentage: Tom DeLay (R), 63%
|
% white |
% black |
% Hispanic |
% Asian |
Total district population |
| 2000 population |
60 |
10 |
20 |
8 |
651,619 |
| 2008 population (est.) |
52 |
12 |
23 |
12 |
866,297 |
| Change from 2000 to 2008 |
-8 |
+2 |
+3 |
+4 |
+214,678 |
| 2000 presidential results |
2008 presidential results |
Partisan swing from 2000 to 2008 |
| 68% Bush-32% Gore |
59% McCain-40% Obama |
-9% Republican, +8% Democratic |
District 25 (Dark Pink): Fort Bend and Harris Counties-Houston, Belaire, University Place, South Houston, Baytown
2002 winner and winning percentage: Chris Bell (D), 55%
|
% white |
% black |
% Hispanic |
% Asian |
Total district population |
| 2000 population |
37 |
23 |
34 |
5 |
651,619 |
| 2008 population (est.) |
32 |
22 |
40 |
5 |
683,417 |
| Change from 2000 to 2008 |
-5 |
-1 |
+6 |
0 |
+156,401 |
| 2000 presidential results |
2008 presidential results |
Partisan swing from 2000 to 2008 |
| 48% Bush-52% Gore |
41% McCain-59% Obama |
-7% Republican, +7% Democratic |
District 29 (Grayish Green): Harris County-Houston, Jacinto City, Galena Park, South Houston
2002 winner and winning percentage: Gene Green (D), 95%
|
% white |
% black |
% Hispanic |
% Asian |
Total district population |
| 2000 population |
20 |
15 |
62 |
2 |
651,620 |
| 2008 population (est.) |
16 |
13 |
68 |
2 |
825,305 |
| Change from 2000 to 2008 |
-4 |
-2 |
+6 |
0 |
+173,685 |
| 2000 presidential results |
2008 presidential results |
Partisan swing from 2000 to 2008 |
| 39% Bush-61% Gore |
31% McCain-69% Obama |
-8% Republican, +8% Democratic |
Central Texas
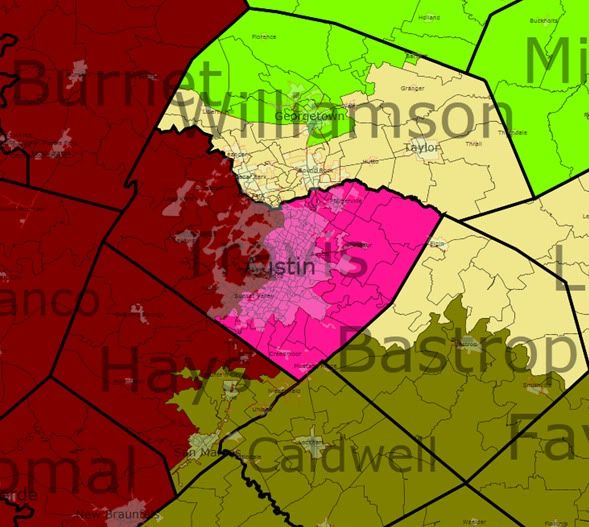
District 10 (Magenta): Travis County-Austin
2002 winner and winning percentage: Lloyd Doggett (D), 84%
|
% white |
% black |
% Hispanic |
% Asian |
Total district population |
| 2000 population |
50 |
11 |
33 |
4 |
651,619 |
| 2008 population (est.) |
45 |
10 |
38 |
5 |
809,987 |
| Change from 2000 to 2008 |
-5 |
-1 |
+5 |
+1 |
+158,368 |
| 2000 presidential results |
2008 presidential results |
Partisan swing from 2000 to 2008 |
| 47% Bush-53% Gore |
28% McCain-70% Obama |
-19% Republican, +17% Democratic |
District 11 (Lime Green): Central Texas-Waco, Georgetown, Temple, Killeen
2002 winner and winning percentage: Chet Edwards (D), 52%
|
% white |
% black |
% Hispanic |
% Asian |
Total district population |
| 2000 population |
64 |
15 |
16 |
2 |
651,620 |
| 2008 population (est.) |
61 |
15 |
20 |
2 |
742,620 |
| Change from 2000 to 2008 |
-3 |
0 |
+4 |
0 |
+91,000 |
| 2000 presidential results |
2008 presidential results |
Partisan swing from 2000 to 2008 |
| 67% Bush-33% Gore |
61% McCain-38% Obama |
-6% Republican, +5% Democratic |
District 14 (Bronze): Texas Hill Country and Texas Coastline-Victoria, San Marcos, Calhoun, Seguin
2002 winner and winning percentage: Ron Paul (R), 68%
|
% white |
% black |
% Hispanic |
% Asian |
Total district population |
| 2000 population |
58 |
8 |
32 |
1 |
651,620 |
| 2008 population (est.) |
54 |
8 |
35 |
1 |
751,893 |
| Change from 2000 to 2008 |
-4 |
0 |
+3 |
0 |
+100,273 |
| 2000 presidential results |
2008 presidential results |
Partisan swing from 2000 to 2008 |
| 66% Bush-34% Gore |
62% McCain-37% Obama |
-4% Republican, +3% Democratic |
District 21 (Maroon): Central/West Texas-San Antonio, Austin, New Braunfels
2002 winner and winning percentage: Lamar Smith (R), 73%
|
% white |
% black |
% Hispanic |
% Asian |
Total district population |
| 2000 population |
77 |
2 |
17 |
2 |
651,619 |
| 2008 population (est.) |
74 |
2 |
20 |
3 |
779,551 |
| Change from 2000 to 2008 |
-3 |
0 |
+3 |
+1 |
+127,932 |
| 2000 presidential results |
2008 presidential results |
Partisan swing from 2000 to 2008 |
| 73% Bush-27% Gore |
62% McCain-37% Obama |
-11% Republican, +10% Democratic |
District 31 (Beige): Central Texas and Houston suburbs/exurbs: Round Rock, Bryan, Sealy, Katy
2002 winner and winning percentage: John Carter (R), 69%
|
% white |
% black |
% Hispanic |
% Asian |
Total district population |
| 2000 population |
69 |
9 |
17 |
3 |
651,620 |
| 2008 population (est.) |
64 |
9 |
21 |
4 |
780,639 |
| Change from 2000 to 2008 |
-5 |
0 |
+4 |
+1 |
+129,019 |
| 2000 presidential results |
2008 presidential results |
Partisan swing from 2000 to 2008 |
| 72% Bush-28% Gore |
60% McCain-38% Obama |
-12% Republican, +10% Democratic |
West Texas
District 13 (Tan): West Texas-Wichita Falls, Amarillo
2002 winner and winning percentage: Mac Thornberry (R), 79%
|
% white |
% black |
% Hispanic |
% Asian |
Total district population |
| 2000 population |
70 |
6 |
22 |
1 |
651,619 |
| 2008 population (est.) |
65 |
6 |
26 |
1 |
654,677 |
| Change from 2000 to 2008 |
-5 |
0 |
+4 |
0 |
+3,058 |
| 2000 presidential results |
2008 presidential results |
Partisan swing from 2000 to 2008 |
| 75% Bush-25% Gore |
76% McCain-23% Obama |
+1% Republican, -2% Democratic |
District 16 (Bright Green): El Paso County: El Paso
2002 winner and winning percentage: Silvestre Reyes (D), unopposed
|
% white |
% black |
% Hispanic |
% Asian |
Total district population |
| 2000 population |
17 |
3 |
78 |
1 |
651,619 |
| 2008 population (est.) |
14 |
3 |
81 |
1 |
683,417 |
| Change from 2000 to 2008 |
-3 |
0 |
+3 |
0 |
+59,428 |
| 2000 presidential results |
2008 presidential results |
Partisan swing from 2000 to 2008 |
| 41% Bush-59% Gore |
33% McCain-66% Obama |
-8% Republican, +7% Democratic |
District 17 (Iris): West Texas: Abilene, San Angelo
2002 winner and winning percentage: Charlie Stenholm (D), 51%
|
% white |
% black |
% Hispanic |
% Asian |
Total district population |
| 2000 population |
75 |
4 |
20 |
1 |
651,619 |
| 2008 population (est.) |
71 |
4 |
23 |
1 |
683,417 |
| Change from 2000 to 2008 |
-4 |
0 |
+3 |
0 |
+16,986 |
| 2000 presidential results |
2008 presidential results |
Partisan swing from 2000 to 2008 |
| 72% Bush-28% Gore |
75% McCain-24% Obama |
+3% Republican, -4% Democratic |
District 19 (Pea Green): West Texas-Lubbock, Big Spring, Midland, Odessa
2002 winner and winning percentage: Larry Combest (R), 92%
2003 special election winner and winning percentage: Randy Neugebauer (R), 51%
|
% white |
% black |
% Hispanic |
% Asian |
Total district population |
| 2000 population |
58 |
6 |
34 |
1 |
651,619 |
| 2008 population (est.) |
53 |
6 |
39 |
1 |
689,654 |
| Change from 2000 to 2008 |
-5 |
0 |
+5 |
0 |
+38,035 |
| 2000 presidential results |
2008 presidential results |
Partisan swing from 2000 to 2008 |
| 76% Bush-24% Gore |
73% McCain-27% Obama |
-3% Republican, +3% Democratic |
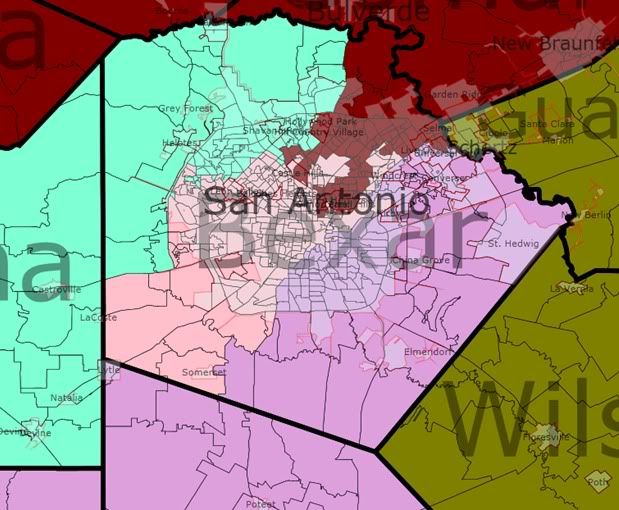
San Antonio and South Texas
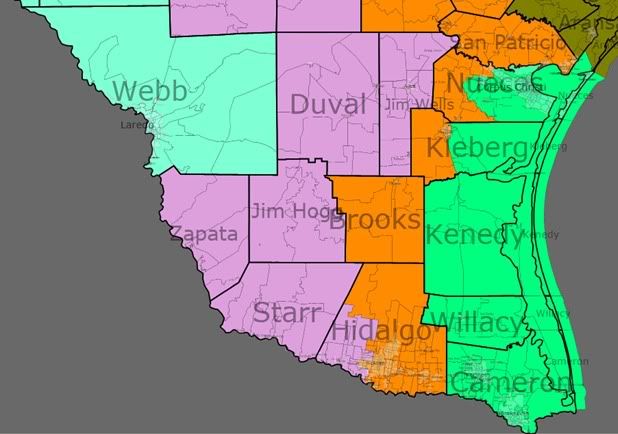
District 15 (Tangerine): South Texas- McAllen, Kingsville
2002 winner and winning percentage: Ruben Hinojosa (D), unopposed
|
% white |
% black |
% Hispanic |
% Asian |
Total district population |
| 2000 population |
17 |
3 |
78 |
1 |
651,619 |
| 2008 population (est.) |
14 |
3 |
81 |
1 |
711,047 |
| Change from 2000 to 2008 |
-3 |
0 |
+3 |
0 |
+59,428 |
| 2000 presidential results |
2008 presidential results |
Partisan swing from 2000 to 2008 |
| 41% Bush-59% Gore |
33% McCain-66% Obama |
-8% Republican, +7% Democratic |
District 20 (Light Pink): Bexar County-San Antonio
2002 winner and winning percentage: Charlie Gonzalez, unopposed
|
% white |
% black |
% Hispanic |
% Asian |
Total district population |
| 2000 population |
24 |
5 |
68 |
1 |
651,619 |
| 2008 population (est.) |
21 |
5 |
71 |
2 |
776,861 |
| Change from 2000 to 2008 |
-3 |
0 |
+3 |
+1 |
+125,242 |
| 2000 presidential results |
2008 presidential results |
Partisan swing from 2000 to 2008 |
| 43% Bush-57% Gore |
36% McCain-63% Obama |
-7% Republican, +6% Democratic |
District 23 (Light Blue): West and South Texas: El Paso, Eagle Pass, Laredo, San Antonio
2002 winner and winning percentage: Henry Bonilla (R), 52%
|
% white |
% black |
% Hispanic |
% Asian |
Total district population |
| 2000 population |
30 |
1 |
67 |
1 |
651,619 |
| 2008 population (est.) |
27 |
1 |
69 |
1 |
728,212 |
| Change from 2000 to 2008 |
-3 |
0 |
+2 |
0 |
+76,593 |
| 2000 presidential results |
2008 presidential results |
Partisan swing from 2000 to 2008 |
| 59% Bush-41% Gore |
50% McCain-49% Obama |
-9% Republican, +8% Democratic |
District 27 (Spring Green): South Texas-Corpus Christi, Harlingen, Brownsville
2002 winner and winning percentage: Solomon Ortiz, 61%
|
% white |
% black |
% Hispanic |
% Asian |
Total district population |
| 2000 population |
25 |
2 |
72 |
1 |
651,619 |
| 2008 population (est.) |
21 |
2 |
75 |
1 |
717,846 |
| Change from 2000 to 2008 |
-4 |
0 |
+3 |
0 |
+66,227 |
| 2000 presidential results |
2008 presidential results |
Partisan swing from 2000 to 2008 |
| 49% Bush-51% Gore |
43% McCain-56% Obama |
-6% Republican, +5% Democratic |
District 28 (Rose): South Texas and Bexar County: San Antonio, McAllen
2002 winner and winning percentage: Ciro Rodriguez (D), 71%
|
% white |
% black |
% Hispanic |
% Asian |
Total district population |
| 2000 population |
21 |
8 |
70 |
1 |
651,620 |
| 2008 population (est.) |
19 |
7 |
72 |
1 |
761,316 |
| Change from 2000 to 2008 |
-2 |
-1 |
+2 |
0 |
+109,696 |
| 2000 presidential results |
2008 presidential results |
Partisan swing from 2000 to 2008 |
| 41% Bush-59% Gore |
36% McCain-63% Obama |
-5% Republican, +4% Democratic |
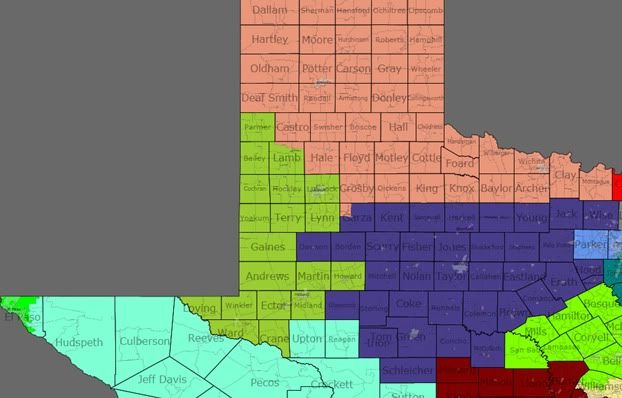
So what would have happened in the past three elections had this map stayed in place for the rest of the decade? Often people assume that the Anglo Democratic incumbents who were targeted would have been reelected had the redistricting not occurred. This is definitely true in the case of Martin Frost, Lloyd Doggett, and Chris Bell, whose already Democratic and urban districts have shifted even more to the left since 2000. But the other Anglo Democrats largely came from more rural, Republican-leaning areas, and their districts all went for Bush in 2000. This list includes Max Sandlin, Jim Turner, Ralph Hall, Nick Lampson, Chet Edwards, and Charles Stenholm. Now let’s look at a county map of Texas showing the change between 2000 and 2008, with the congressional districts where Gore outperformed Obama superimposed over the map.
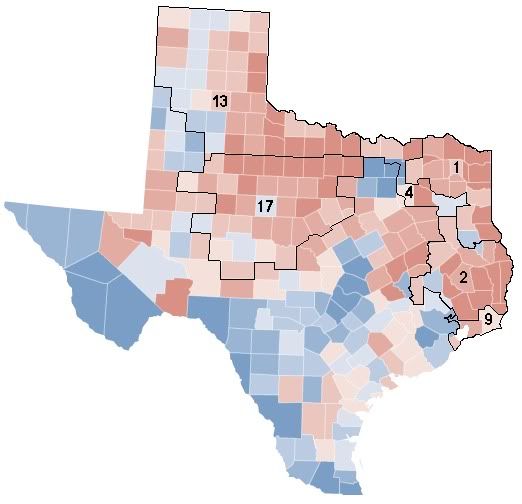
Despite a roughly 4% move towards the Democrats statewide between 2000 and 2008, there were 6 congressional districts where Obama actually did worse than Gore: TX-01 (Max Sandlin (D)), TX-02 (Jim Turner (D)), TX-04 (Ralph Hall (D)), TX-09 (Nick Lampson (D)), TX-13 (Mac Thornberry (R)), and TX-17 (Charlie Stenholm (D)). Besides TX-13, all of these districts elected Democrats in 2002. In addition, all of the Anglo Democrats elected in districts that Bush won in 2000 saw their districts become more Republican over time, with one exception. TX-11 in Central Texas would have become notably more Democratic during this time period, and its representative, Chet Edwards, is the only one of these men still in office as a Democrat.
However, I am not convinced that the marked rightward shift would have occurred inevitably had the boundaries not changed in the 2003 redistricting. Many residents in these districts were trending Republican at the presidential level, but felt comfortable continuing to vote for Democrats at the congressional level. But in 2004, the redrawn districts included areas that had previously been represented by Republicans or by other targeted Democratic members, meaning the advantage of incumbency was greatly diminished. This led to the defeat, party switching, or retirement of all the legislators listed above, but I believe, also contributed to these areas becoming more Republican at the presidential level in 2004 and 2008. Without the option to vote for a familiar incumbent Democrat for Congress further down the ballot, voters felt less inclined to vote for a Democrat at any level, including President. Had the 2003 redistricting not occurred, I believe not only that several of these lawmakers might still be in office, but Obama may have even performed better in these districts in 2008.
Other than the representatives just discussed, I believe that all of the other Democratic and Republican incumbents would still be in office right now, with the possible exceptions of John Culberson (R, 7th) and Henry Bonilla (R, 23rd), whose districts would have become much more competitive by the end of the decade. But I think this analysis shows that in the long-term, Texas is turning blue, and it is only a matter of time before the shifts to the Democrats in the Houston area, the Dallas/Forth Worth Area, and Central Texas finally push Texas into the Democratic column.

Loading ...


Thank you so much for doing this!
I marked TX-1, 2, 4, 11, and 23 as switching but I’m a bit unsure on TX-2 and 11. With 11, the questions is how Stenholm would have used his seniority as AG committee chairman once Dems retook power in 2006. Had that power switch never occurred, 11 is a definite switch (or he could have retired, he was quite old.)
I think Ralph Hall was going was going to switch parties eventually, so mark it as a loss.
1 and 2 . . . I think it’s more likely they would switch than not. Sandlin’s 56% win in 2000 seems low to me for someone who would have to deal with a district that lost 6% of democratic presidential support. A stronger 2000 showing would give me more confidence, but this is just too weak. Turner’s 61% is strong enough for me to think he could have done it, but I think District 2 is the perfect example of a district getting in line with national straight ticket Republican trends. Suburban White folk moving in around Tyler County would take Turner out, me thinks.
Still, with this map Dems would have kept Lampson, Frost, and flipped Bonilla. (Bell flipped to A. Green, so no real loss with him). Overall, TX Dems would have been +3 members from today with Frost as Rules Chairman and Stenholm would have been Agriculture chairman.
14 Dems, 18 GOP, Dems represent 43.75% of the state, which is what dems seem to get statewide these days, the old map was pretty fair and accurate. Shame it got elminated. And Lampson was forcibly taken away as my congressman who could be somewhat liberal. ;-/
I started on something like this a couple of times but ran out of steam. I think it goes to show that you can’t fully predict political trends 20 years out.
Wow. Excellent work.
A few comments:
It’s amazing to observe the shifts in Austin, and, by extension, Travis County. What an amazing shift over the past eight years. I know that Doggett’s district has gotten more Hispanic, but what also has made that shift more pronounced? I would love an answer to that.
I think Chet Edwards would love to have a district that Democratic!
It’s also amazing to me the power of personal popularity for congress critters like Charlie Stenholm. Crazy that he could win all those years in the most conservative exurban part of the state, let alone the country.
And, possumtracker, I hope for all of our sakes that this diary doesn’t get bumped down by some non-substantive post!
I mapped those on Dave’s App and can post that diary at some point too if you guys are interested. I would be really grateful if anyone with the 2002 edition (107th Congress) of the Almanac of American Politics could post the demographic/political data for those districts so I could show the shifts since the 1990 Census and 2000 election.
Excellent information! And while I was aware that DeLay was my congressman in 2002 i didnt realize that my residential subdivision & precinct were literally on the border with Lampson’s! My current home of Seabrook was also in DeLay’s district back then. Both homes are in TX-22 (Olson) now.
I never thought of doing a map where you put old congressional district lines on the map and see how they would be now. I think Georgia would be a good state to do if it had partisan data.
Also, I was going to post another county baselines diary on Sunday but I’ll hold off a few more days because this diary rocks!
but enjoyed this interesting diary.
I’d like you to comment more on this part:
What’s the evidence for the “trickle-up” effect in party performance?
Ross Perot got 22% in Texas in 1992, which undoubtedly is reflected in some of the congressional district results. Say there was a district that was 35% Bush, 40% Clinton, and 25% Perot in 1992. Looking at just the ratio of Bush-Clinton results though, this becomes 53% Clinton-47% Bush, which more accurately represents the partisan divide between the two candidates. If I wanted to contrast the results that year with the 2008 results then should I show the raw results, of the ratio between the two candidates? Same thing would apply for 1996.