PBI or Party Brand Index is a concept I developed (with some much appreciated help from pl515) as a replacement for PVI. PVI (Partisan Voting Index), which is measured by averaging the percentage of the vote from the last two presidential elections in each house district, and comparing it to the nation as a whole, is a useful shorthand for understanding the liberal v. conservative dynamics of a district. But PVI in my opinion it falls short in a number of areas. First it doesn’t explain states like Arkansas or West Virginia. These states have districts who’s PVIs indicates a Democrat shouldn’t win, yet Democrats (outside of the presidency) win quite handily. Secondly why is this the case in Arkansas but not Oklahoma with similar PVI rated districts?
Lastly PVI can miss trends as it takes 4 years to readjust. The purpose of Party Brand Index is to give a better idea of how a candidate does not relative to how the presidential candidate did, but compared to how their generic PARTY should be expected to perform. I’ve tackled IN, NC, CO, VA, MO, OK, AR, now I will look at the swing states of Nevada and Iowa.
First I would like to post the data, then I will offer some analysis. My basic pattern is to work my way “out” from the “Purple States” to the more Blue and Red ones. Two weeks ago (I took one week off for Netroots Nation) I skipped my normal pattern of working out from purple states. I became curious on how my model would work in states like Arkansas that are deeply blue at the local level, but deeply red at the presidential level. I will offer a refresher on them later. But first let’s examine the swings states of Iowa and Nevada.
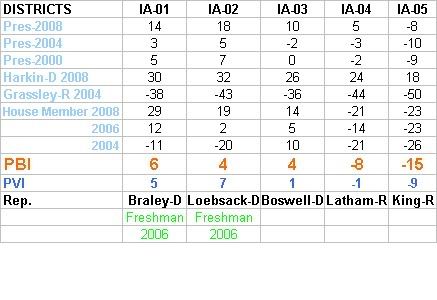
IOWA
NEVADA
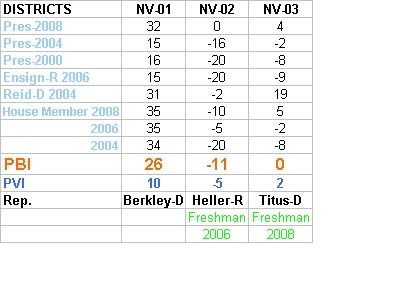
Both of these states have fairly “straightforward” Democratic or Republican leaning districts, only Iowa Rep. Boswell is a Blue Dog. Rep. Titus in Nevada’s 3rd district was designed as a swing district where there would be a equal number of Democrats and Republicans. PBI maintains this is still the case, while PVI suggest a slight Democratic lean. Also Republican Rep. Lantham of Iowa who is frequently mention as a target of Democrats because of his district’s PVI of only +1 Republican, is actually much safer based on PBI -8 (the equivalent of a PVI of 8), which is much closer to his winning margins.
Just a quick note as a reminder on Blue Dogs like Boswell, I developed a “correction factor” that allows for a better “explanation” for congresspersons who win districts that are a “mismatch” for their party’s majority ideology. I would prefer to run a “batch” of these at a time. So I will simply republish the results for the four Blue Dogs I have encountered since I started this research.
FOUR BLUE DOGS
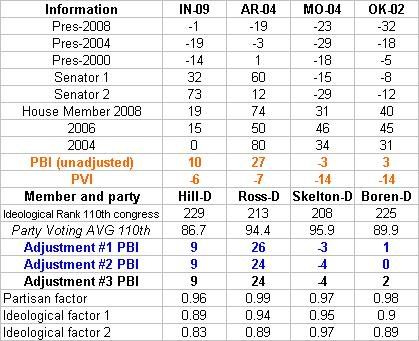
I developed a formula based on standard deviations. Basically I can figure out how much the average rep deviates from their district. If I then compare where a reps voting pattern falls (in what percentile) and compare it to their district’s PVI, I can develop a “standard deviation factor”. Inside the standard deviation will get a bonus, outside a negative. The idea is that if a Blue Dog has a very conservative record, they may be surviving not because of a districts Democratic leanings but because they deviate from Democratic policies. I showed all three variation of my formula but for future examples I will stick to ADJUSTMENT FACTOR #2.
For example, if Rep X is the 42 most conservative rep, that would place her in the 90th percentile. But if her district’s PVI was “only” the in the 60th, their is a good chance her margins would be effected. Using a few random samples I found most reps lie within 12% of their district’s PVI.
Using these dummy numbers I then came up with this.
SQRT[(30-12)^2 /2] = about 13%Her factor would then be 100 – 13 = 0.87.
So her victory margin would be weighted by 0.87 because she is more than 12% beyond her acceptable percentile range it making the victories in her district approximate 13% less “representative”.
My theory yields the following formula:
If rep’s voting record is > PVI then
100 – SQRT[({Record percentile – PVI} – Standard PVI Sigma)^2 /2] = factor
else if rep’s voting record < PVI
100 + SQRT[({Record percentile – PVI} – Standard PVI Sigma)^2 /2] = factor
I then repeated this formula to calculate a partisanship correction factor. Ranking a members ideology is a subjective decision. Potentially what’s one person “liberal” position, is another person “conservative” ones, remember the wingers developed a model that ranked the Sen. Obama as more liberal than Bernie Sanders or Russ Feingold. But partisanship, how often a member votes with their party is an absolute number. A Democrat who represents a “republican district” would be expected to “break with their party” on votes that don’t reflect their districts values.
I couldn’t find a website that ranks all the districts based on their PVI (I only could find list of them by state not rank, help please anyone), therefor I substituted a PVI ranking with where each member ranked in the Democratic caucus. In the 110th Congress the average Democrat had an ideological ranking of 170 (by the way this is a result of several members being tied, this is the medium not the midpoint). The average of members towards the center was 191, former Daily Kos celeb Ciro Rodriguez fell at exactly 191. The average of members towards the liberal side was 121, which falls between Rep. Larson of Conn. and Rep. Eshoo of CA. As or partisanship in the 110th Congress the average Democrat voted with their party 92.3% of the time.
As a clarification in Adjustment #1, I used a deviation factor based on how far each member was from the center of the Democratic caucus. Adjustment #2 was based on how far each member was from outside the standard deviation of the caucus. In Adjustment #3 I removed the partisanship factor to see what effect it would have.
Because there are “only” 50 states (as opposed to evaluating 435 house members), I will at a later date have all the states ranked by PVI so I can adjust the Senator’s rankings. I developed Senate factors for the four states the four blue dogs came from. In the interest of full disclosure, my source for ideological rankings is Voteview, and for partisanship it was the Washington Post. This is still a work in progress, I’m making adjustments, and continuing to crunch numbers for more states. I also will use the adjustment factor on a liberal member of congress to see what effect that will have.
It’s a little over my head but it looks great to me!
Runs on the same software as Swing State Project, only takes a minute to sign up for an account.