I have been working on a concept I’m calling PBI or Party Brand Index, as a replacement for PVI. PVI (Partisan Voting Index), which is measured by averaging voting percentage from the last two presidential elections in each house district, and comparing it to how the nation as a whole voted, is a useful shorthand for understanding the liberal v. conservative dynamics of a district. But in my opinion it falls short in a number of areas. First it doesn’t explain states like Arkansas or West Virginia. These states have districts who’s PVI indicates a Democrat shouldn’t win, yet Democrats (outside of the presidency) win quite handily. Secondly why is this the case in Arkansas but not Oklahoma with similar PVI rated districts?
Secondly PVI can miss trends as it takes 4 years to readjust. The main purpose of Party Brand Index is to give a better idea of how a candidate does not relative to how the presidential candidate did, but compared to how their generic PARTY would be expected to perform. This week I’ll tackle North Carolina.
Last week I tackled Colorado and Virginia in PBI part 2. My general strategy is to work my way “out” from swing states.
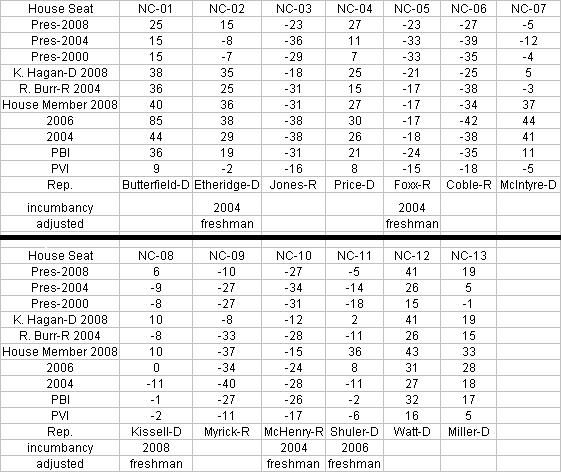
Some of the divergences between PBI and PVI in North Carolina are, Rep. Etheridge who has won by margins of between 29-36% goes from being in a lean GOP district to a safe Democratic district. Similarly Rep. McIntyre who has won with between 44 – 37% of the vote goes from being in a lean GOP district (-5 PVI) to a moderate democratic one of (+11 PBI).
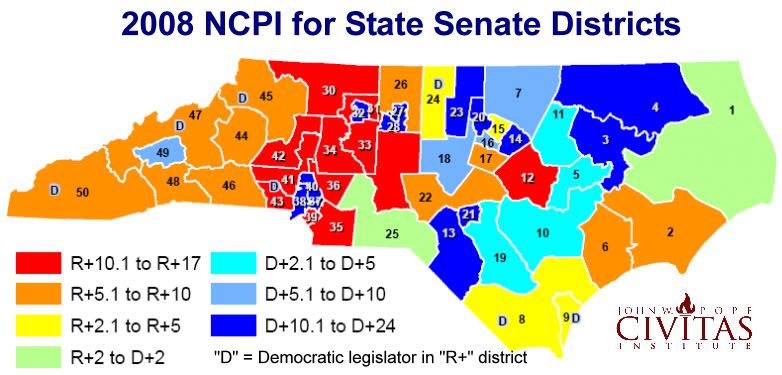
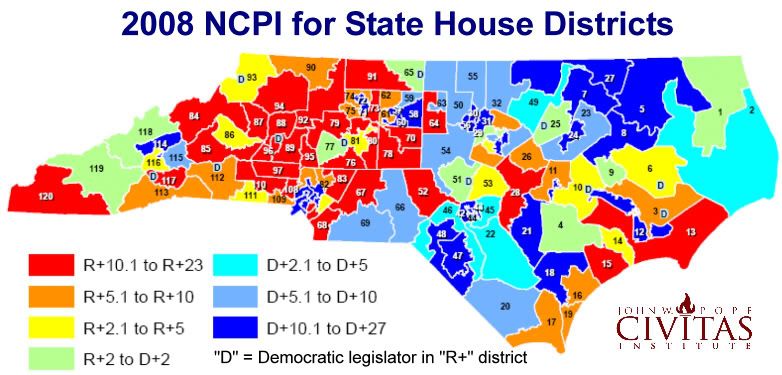
For more North Carolina fun in 2008, the Civitas Institute premiered the North Carolina Partisan Index using data from the 2004 General Election. Even though the Civitas Institute is libertarian their numbers and calculations are open sourced, and are valid.
This year, we have updated the NCPI to reflect voters’ choices in the 2008 General Election.
Modeled after the Cook Partisan Voting Index developed for congressional districts, the North Carolina Partisan Index compares the political leanings of voters in each state house and senate district with the partisan voting tendencies of the state as a whole. The end result is a letter (D or R) followed by a number, indicating the extent to which each district leans one way or the other.
The new NCPI was developed using adjusted 2008 data on the elections for Governor and other council of state offices – Lieutenant Governor, Attorney General, Commissioners of Agriculture, Labor, and Insurance, Secretary of State, State Auditor, State Treasurer, and Superintendent of Public Instruction.
______________________________________________________________________________
As a reminder I will review how I calculate Party Brand Index.
To compute PBI I basically did the following. I weighed the last 3 presidential elections by a factor of 0.45. Presidential preference is the most indicative vote since it’s the one politician people follow the most. The POTUS is the elected official people identify with or despise the most, thus illuminating their own ideological identification. I then weighed each house seat by 0.35. House seats are gerrymandered and the local leader can most closely match their districts make up in a way the POTUS can’t. So even though they have a lower profile I still gave them a heavy weight. Lastly I gave the last two Senate elections a weight of 0.2. Senatorial preference can make a difference, although I think it’s less than that of the President or the House members. Also (more practically) because I have to back calculate (estimate) Senate result totals from county results, a smaller number helps lessen the “noise” caused by any errors I may make. Under my system Democratic leaning have a positive number, the GOP has a negative number.
I then developed a way to weight for incumbents. The reelection numbers for incumbents is so high it would be a mistake to weight a district solely on the fact that an incumbent continues to get elected. There is a long list of districts that have PVI that deviate from their incumbent members, whom none the less keep getting elected. These districts then change parties as soon as the incumbent member retires. This is evidence that incumbency can disguise the ideology of voters in a district.
Next I added a weighting of about 7% for House members. I remember reading that incumbency is worth about 5-10%. Nate wrote in a 538.com article that a VP pick from a small state was worth about a 7% swing, a house seat could in fact be thought of as a small state, that seems as good a number as any to start from. Conversely I will deduct 7% from an incumbents win. I think this will score them closer to the natural weight of a district. By the way I’m weighting the win 7% less, not actually subtracting 7% from the number. Open seat races will be considered “pure” events and will remain neutral as far as weighting goes. A seat switching parties will also be considered a neutral event. The 1st defense of a seat by a freshman house member will be given a weighting of 2%. The toughest race for any incumbent is their 1st defense. I decided to adjust for this fact. Note: Indiana’s bloody 9th was a tough call a case could be made that when a seat keeps flipping, and the same two guys run 4 straight times in a row each election should be a neutral event.
Senate weighting is as follows. In state with a single House seat the Senate seat will be weighted the same as a house. In states with multiple seats, the Senate will get a weighting of 2%. Nate Silver stated that a VP pick in a large state is worth this amount. An argument could be made for a sliding scale of Senate weighting from 2-7%, this added complexity may be added at a later date. I will give incumbent presidents a 2% weighting, until I get better data on how powerful a “pull” being the sitting POTUS is, I will give them the same weighting as a senator.
It’s Nate Silver, not Silva.
like their incumbents especially Democrats.