I have been working on (with some much appreciated help from pl515) a concept I’m calling PBI or Party Brand Index, as a replacement for PVI. PVI (Partisan Voting Index), which is measured by averaging voting percentage from the last two presidential elections in each house district, and comparing it to how the nation as a whole voted, is a useful shorthand for understanding the liberal v. conservative dynamics of a district. But in my opinion it falls short in a number of areas. First it doesn’t explain states like Arkansas or West Virginia. These states have districts who’s PVI indicates a Democrat shouldn’t win, yet Democrats (outside of the presidency) win quite handily. Secondly why is this the case in Arkansas but not Oklahoma with similar PVI rated districts?
Secondly PVI can miss trends as it takes 4 years to readjust. The main purpose of Party Brand Index is to give a better idea of how a candidate does not relative to how the presidential candidate did, but compared to how their generic PARTY would be expected to perform. Last week I calculated PBI for Indiana, this week I tackled Colorado and Virginia.
My best case for arguing against PVI is Indiana. Bush won Indiana quite easily in 2000 and 2004. The PVI of a number of it’s districts showed them to be quite Red. Yet in 2006 democrats won several districts despite their PVI’s. Also Obama won Indiana in 2008 a state, which based on the make up of the districts PVIs, made little sense. I therefore chose Indiana as my first test case for PBI:
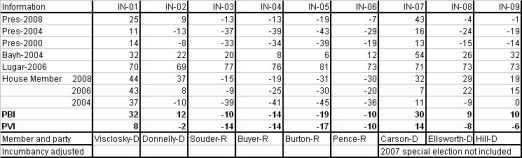
Donnelly in the Indiana 2nd is a perfect example of my issues with PVI. Under PVI Donnelly is in a Republican district with a PVI of -2. But look at how Democrats have recently performed in this district. In 2008 Donnelly won reelection by 37%! Obama won this district by 9 points, and Bayh won it by 22%! Does this sound like a lean GOP district? Under PVI it is, under PBI it’s not it’s a +11 democratic district.
This week I tackled Colorado and Virginia. My general strategy is to work my way “out” from swing states. Both these states have undergone noticable ideological shift. Yet the PVI of their districts haven’t moved as much. This made them ideal candidates.
COLORADO
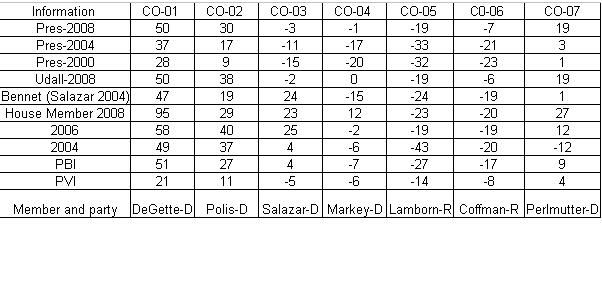
The big difference in Colorado is that Salazar’s district goes from being a lean Republican one under PVI (-5 Republican), to a lean Democratic one (+4 Democrat), considering that a Salazar has held this same seat for some time this makes more sense. Remember I measuring total party preference not just the presidential preference of a district like PVI measures.
VIRGINIA
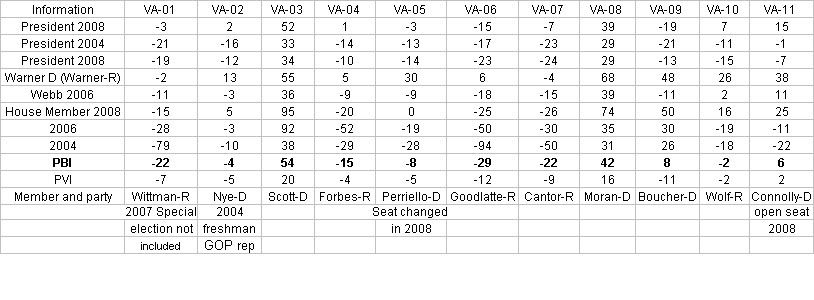
Virginia was the first time I had doubts on my ability to compute rough Senate numbers for House districts based on county totals. My estimates from Mark Warner Senate run yielded results of 3540% in Tom Perriello’s (VA-5th) district. This seemed way to high, even though now Senator Warner won the state with 65% of the vote. At the time Virgil Goode was the representative from the VA-5th, and he lost by only a few hundred votes.- This lead me to do some additional research to try and discover if these numbers were published anywhere. Boy was I wrong Warner actually won the VA-5th by 65%!. Also several of the large victory margins were the results of representatives who ran unopposed. Fixed Party ID, and election results
________________________________________________________________________________
As a reminder I will review how I calculate Party Brand Index.
To compute PBI I basically did the following. I weighed the last 3 presidential elections by a factor of 0.45. Presidential preference is the most indicative vote since it’s the one politician people follow the most. The POTUS is the elected official people identify with or despise the most, thus illuminating their own ideological identification. I then weighed each house seat by 0.35. House seats are gerrymandered and the local leader can most closely match their districts make up in a way the POTUS can’t. So even though they have a lower profile I still gave them a heavy weight. Lastly I gave the last two Senate elections a weight of 0.2. Senatorial preference can make a difference, although I think it’s less than that of the President or the House members. Also (more practically) because I have to back calculate (estimate) Senate result totals from county results, a smaller number helps lessen the “noise” caused by any errors I may make. Under my system Democratic leaning have a positive number, the GOP has a negative number.
I then developed a way to weight for incumbents. The reelection numbers for incumbents is so high it would be a mistake to weight a district solely on the fact that an incumbent continues to get elected. There is a long list of districts that have PVI that deviate from their incumbent members, whom none the less keep getting elected. These districts then change parties as soon as the incumbent member retires. This is evidence that incumbency can disguise the ideology of voters in a district.
Next I added a weighting of about 7% for House members. I remember reading that incumbency is worth about 5-10%. Nate wrote in a 538.com article that a VP pick from a small state was worth about a 7% swing, a house seat could in fact be thought of as a small state, that seems as good a number as any to start from. Conversely I will deduct 7% from an incumbents win. I think this will score them closer to the natural weight of a district. By the way I’m weighting the win 7% less, not actually subtracting 7% from the number. Open seat races will be considered “pure” events and will remain neutral as far as weighting goes. A seat switching parties will also be considered a neutral event. The 1st defense of a seat by a freshman house member will be given a weighting of 2%. The toughest race for any incumbent is their 1st defense. I decided to adjust for this fact. Note: Indiana’s bloddy 9th was a tough call a case could be made that when a seat keeps flipping, and the same two guys run 4 straight times in a row each election should be a neutral event.
Senate weighting is as follows. In state with a single House seat the Senate seat will be weighted the same as a house. In states with multiple seats, the Senate will get a weighting of 2%. Nate Silva stated that a VP pick in a large state is worth this amount. An argument could be made for a sliding scale of Senate weighting from 2-7%, this added complexity may be added at a later date. I will give incumbent presidents a 2% weighting, until I get better data on how powerful a “pull” being the sitting POTUS is, I will give them the same weighting as a senator.
______________________________________
Still to come:
The last major issue is how to deal with the “wingnut” factor. Sometimes a politician like Bill Sali (R-Idaho) or Marylin Musgrove (R-CO)lose because their voting record is outside of the mainstream of their district. I decided to try and factor this in.
First I had to take a brief refresher on statistics. I developed a formula based on standard deviations. Basically I can figure out how much the average rep deviates from their district. If I then compare where a reps voting pattern falls (in what percentile) and compare it to their district’s PVI, I can develop a “standard deviation factor”. Inside the standard deviation will get a bonus, outside a negative.
For example, if Rep X is the 42 most conservative rep, that would place her in the 90th percentile. But if her district’s PVI was “only” the in the 60th, their is a good chance her margins would be effected. Using a few random samples I found most reps lie within 12% of their district’s PVI.
Using these dummy numbers I then came up with this.
SQRT[(30-12)^2 /2] = about 13%Her factor would then be 100 – 13 = 0.87.
So her victory margin would be weighted by 0.87 because she is more than 12% beyond her acceptable percentile range it making the victories in her district approximate 13% less “representative”.
My theory yields the following formula:
If rep’s voting record is > PVI then
100 – SQRT[({Record percentile – PVI} – Standard PVI Sigma)^2 /2] = factor
else if rep’s voting record < PVI
100 + SQRT[({Record percentile – PVI} – Standard PVI Sigma)^2 /2] = factor
To really do this I need to compute the standard deviation for all 435 reps, which is a pretty large undertaking. Instead I will do a google search to see if anyone has already done this. If not well it will take some time. But this would deal with the wingnut factor. Since politician tend to vote relatively close to their districts interest (even changing voting patterns over time) this may not be a major issue. But developing this factor may eventually allow the creation of a “reelection predictor”, so I am still going to work on it.
One last note, the corruption factor (for example Rep. Cao (R-LA) beating former Rep. Jefferson) is outside of any formula I can think of. The only saving grace here is that because my formula uses several elections, the “noise” from a single event will eventually be reduced.
NEXT UP: NC and MO
Have you considered adding data from gubernatorial races?
a bit about this project, and here is one thing I keep wondering about… whether there’s something of a chicken-and-egg problem here in terms of what you’re measuring, maybe best typified by VA-09. Does Boucher win big in this district because it’s a district that has a strong downballot tradition even though it’s trending GOP for Prez? Or does he win big in this district because nobody of consequence ever runs against him, because he has the air of inevitability about him, because he’s been there forever, he’s a good fit with this district (pro-coal, pro-gun, etc.), and because he’s sitting on a ton of money? And here’s the chicken-and-egg part: does nobody of consequence from the GOP run because he wins big because of his own attributes, or because of the district’s downballot tradition?
In other words, I think my theory is that Presidential results are more of a leading indicator and House results are more of a trailing indicator, because it’s near impossible to beat an incumbent and, barring a wave year, you have to wait for an open seat before the House seat can reset so it’s more inline with the Presidential inclinations. (Actually, I think that demographic change is probably the best leading indicator, House results are the trailing indicator, and Prez results are just sort of the “current” indicator.) Just as an example, I think that if we were faced with an open seat in VA-01 and an open seat in VA-09, and we had equivalent candidate quality matchups (which is the kind of ceteris paribus situation that never happens…) we’d actually have a better chance at picking up VA-01 rather than VA-09, because VA-01’s northern end is turning into more DC suburbs, while we’re just doing worse and worse with the blue-collar Appalachian votes that are the bulk of VA-09.
Just a few quick things regarding Virginia. Goodlatte is a Republican, and Nye came into office in 2008, not 2004 (as your numbers indicate). Secondly, I’m wondering about your negative/positive numbers. If negative signifies republican margins, and vice-versa, then there seem to be some discrepancies. Rep. Wolf won last year, but his margin is positive, as opposed to 2004/6. And why are all of Forbes’s margins positive? And is that throwing off the final number? Because I don’t think he’s pbi should end up positive. Finally, are you averaging out the Senate numbers for Warner? Or are you just back calculating, and so you’re numbers are ending up screwy? Because you can find those numbers on Virginia’s Board of Elections Website. Keep up the good work.